Veritas
A data management platform, from API principles to the first dashboard
Veritas makes the software enterprises use to back up, recover, and manage their data. Its Data Management platform brought backup, recovery, classification, and analytics into one product, built API-first. Our work covered that product at three levels: the API program that underlies it, the first hour an administrator spends with it, and the dashboard they return to afterward.
Enterprise data protection is bought carefully and installed slowly. An administrator compares products, tests one, argues for the purchase, then configures hardware node by node before a single backup runs. Each step was a place to lose them. Inside the company the problem was a different one. An API-first platform needs many teams to design APIs the same way, and most of the people who had to agree on that were not going to read a specification.
We started with the people. A persona landscape followed the data protection administrator from discovery to daily use, and that sequence set the order of the screens: a website that explains the product, a setup flow that takes it from hardware to a running cluster, and a dashboard that reports its state.
For the API program, we turned the internal guidance into infographics: one map of the ecosystem and one page of principles, short enough to be read and pinned up.
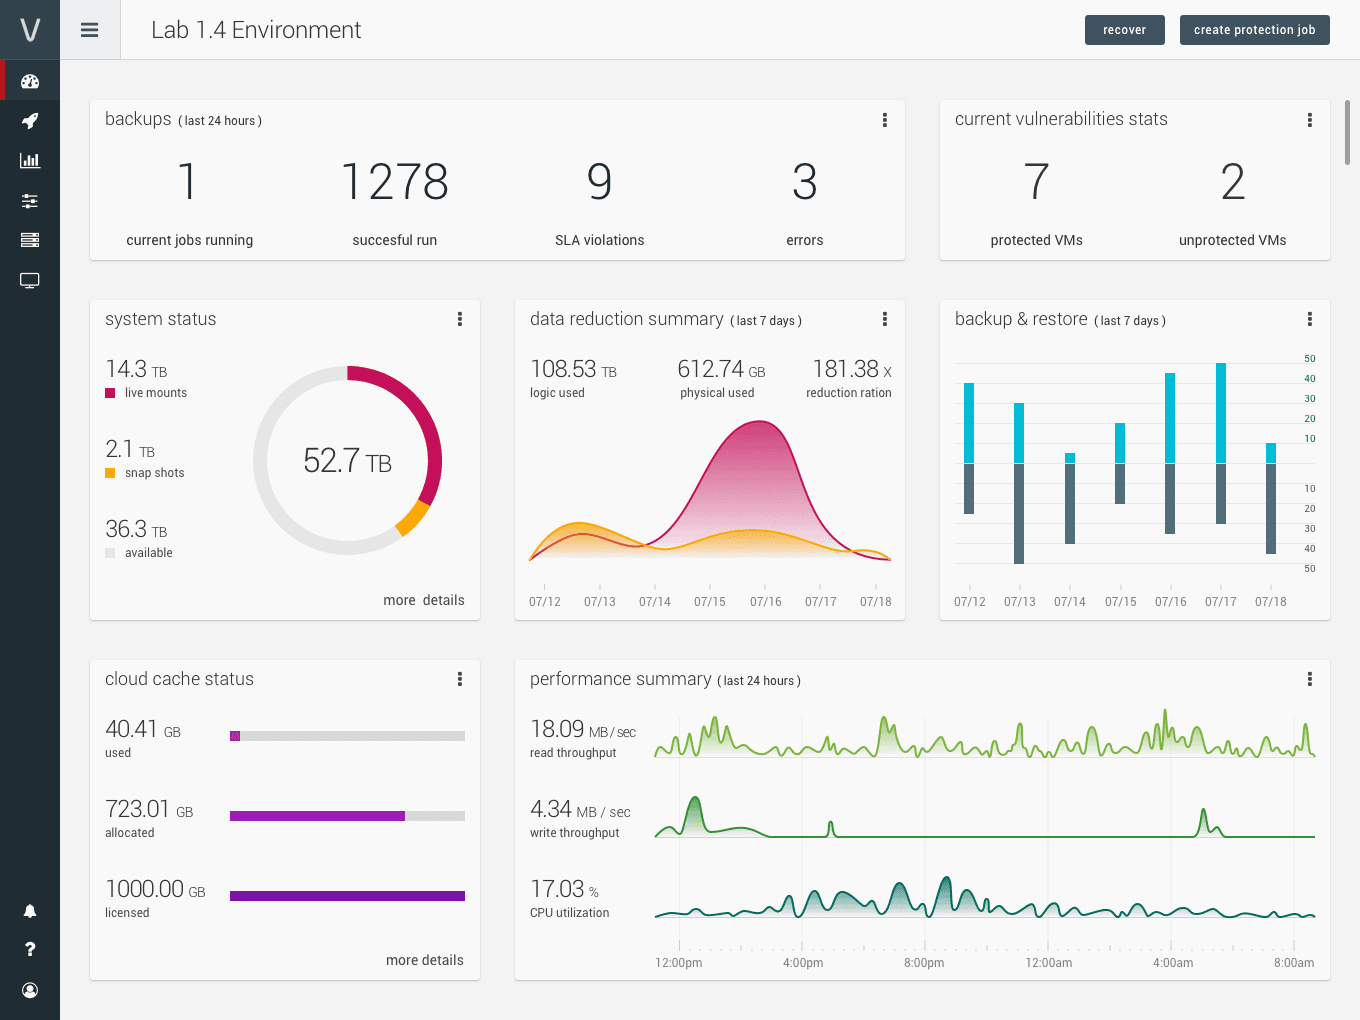
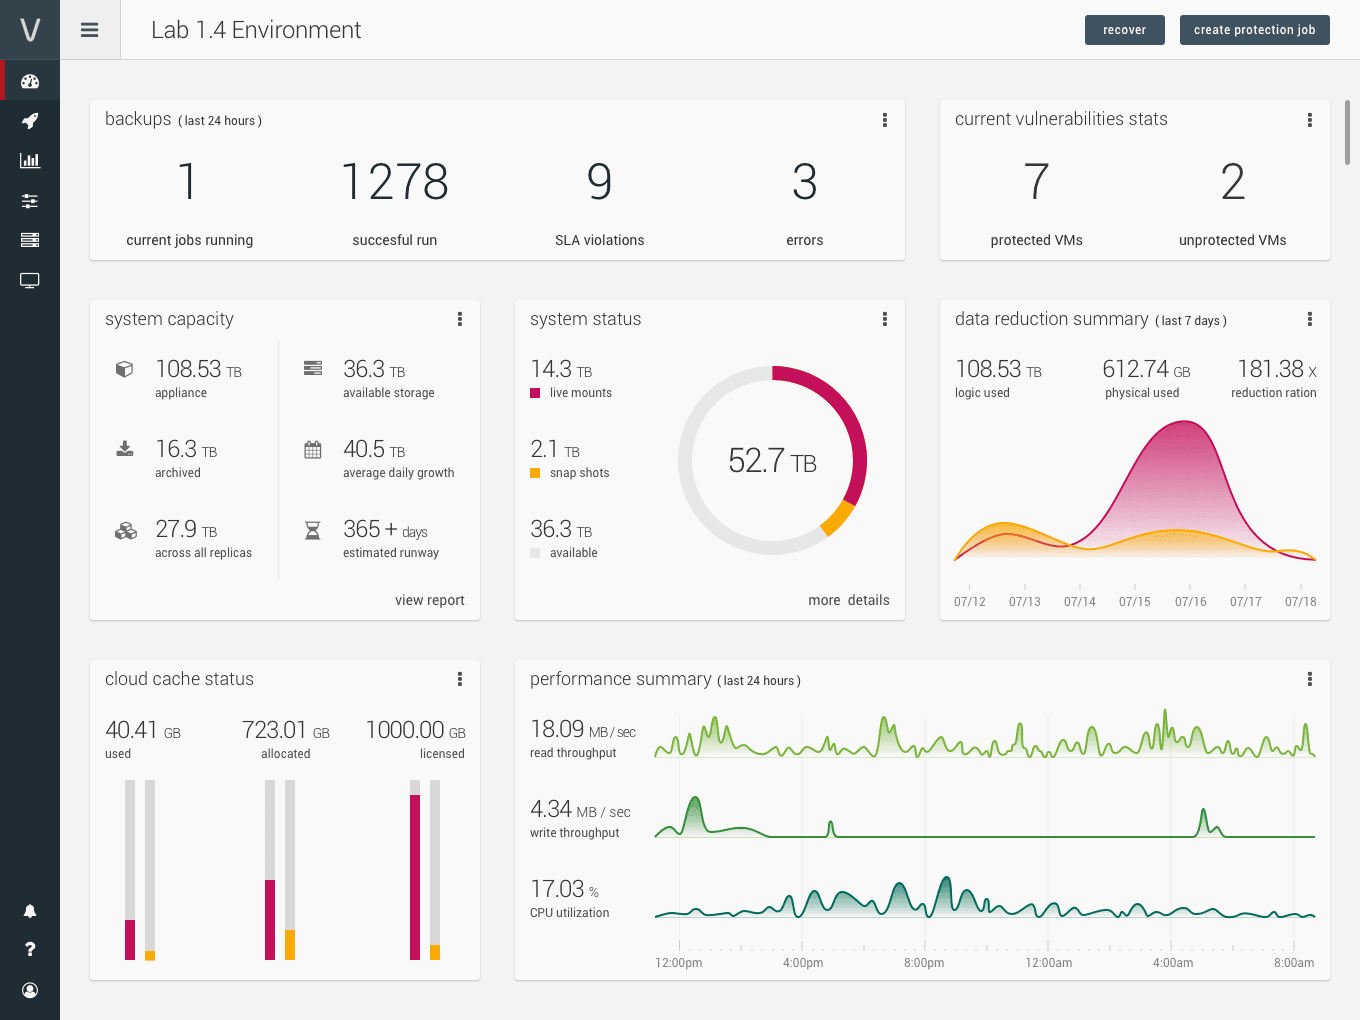
The interface is spare. Numbers are large and labels are small. Color is used only for data.
The platform was API-first, so the work began with the API itself. This map shows the program on one page: the developer on one side, the API team on the other, the developer portal between them, and the tools each side depends on.
API design guidance tends to live in long documents that few people finish. We reduced it to ten principles, each with a sentence or two of reasoning, written to be remembered. Do not build for a specific UI. Use nouns for resources. Be minimal.
The persona landscape traces one role, the data protection administrator, through nine steps: discovering the product, trying it, purchasing, setting up, connecting services, writing policy, protecting data, and assigning access to others. It became the outline for everything that followed.
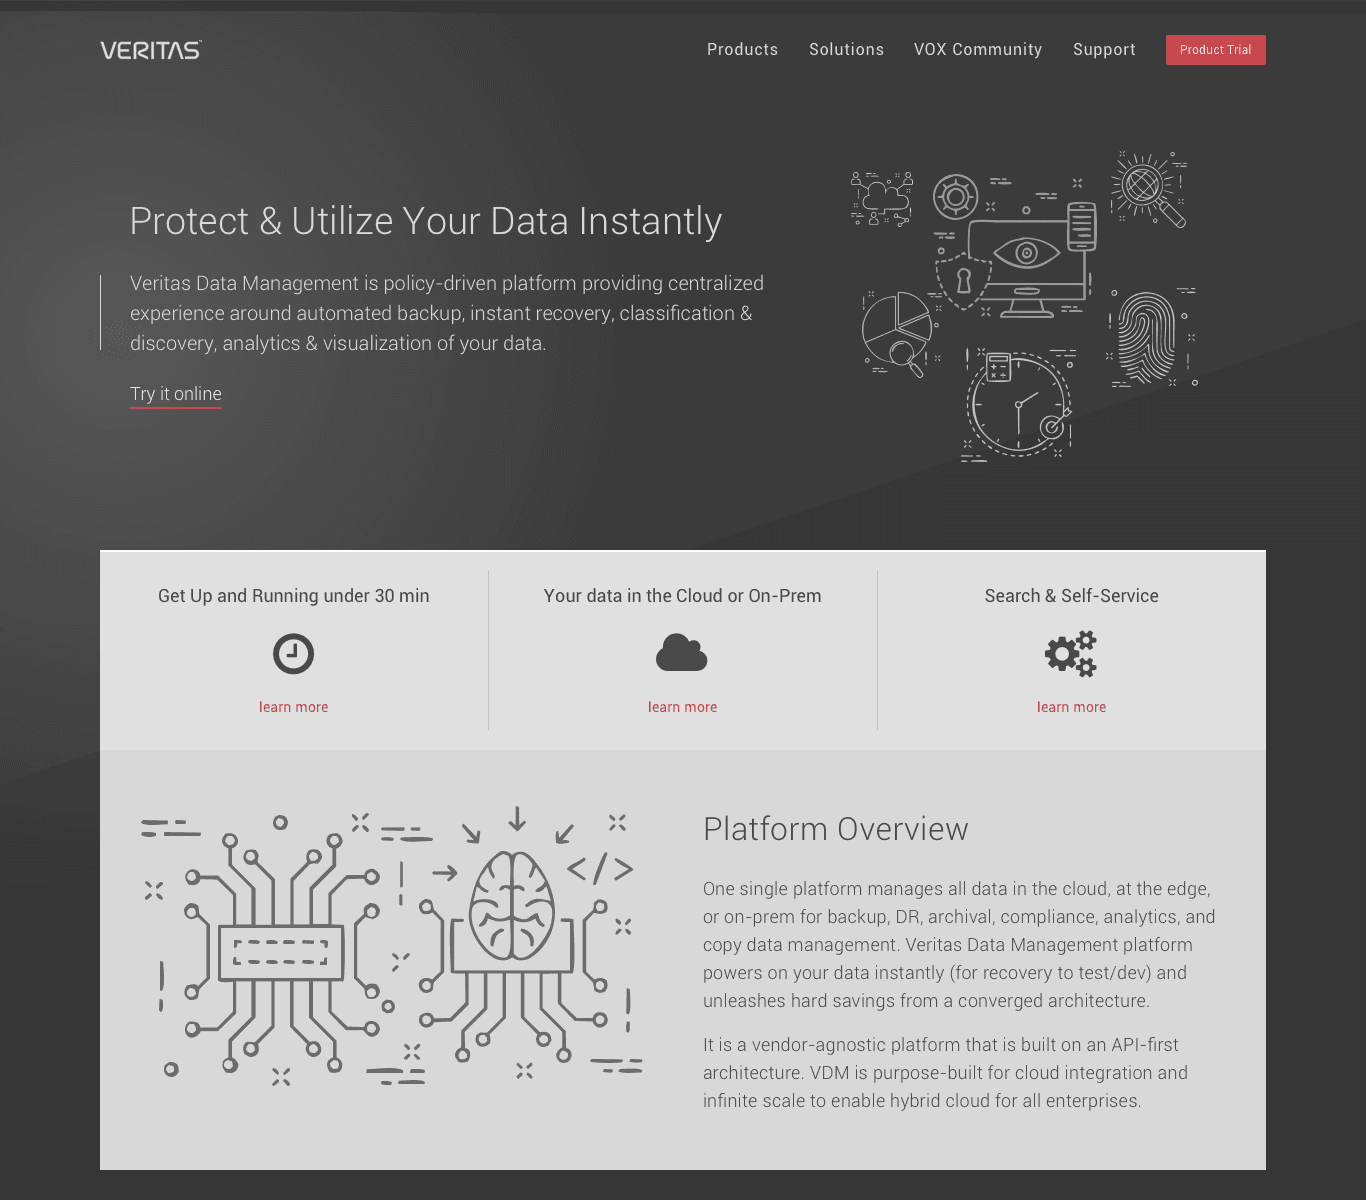
The product page states what the platform does in one sentence, then answers the three questions an evaluator asks first: how fast it is to start, where the data lives, and what users can do for themselves.
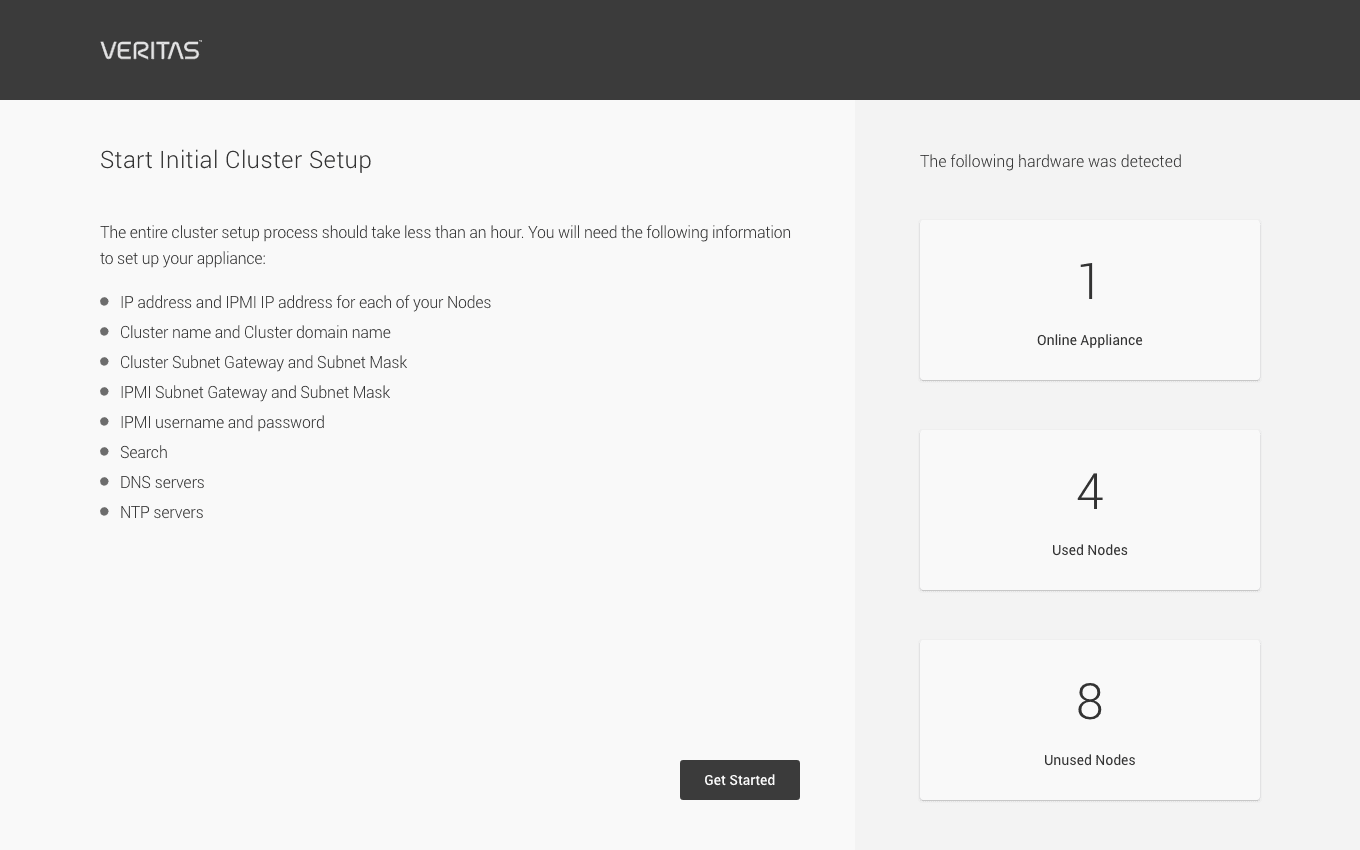
Setup opens by telling the administrator how long it will take and what to have on hand, and by showing the hardware it has already detected.
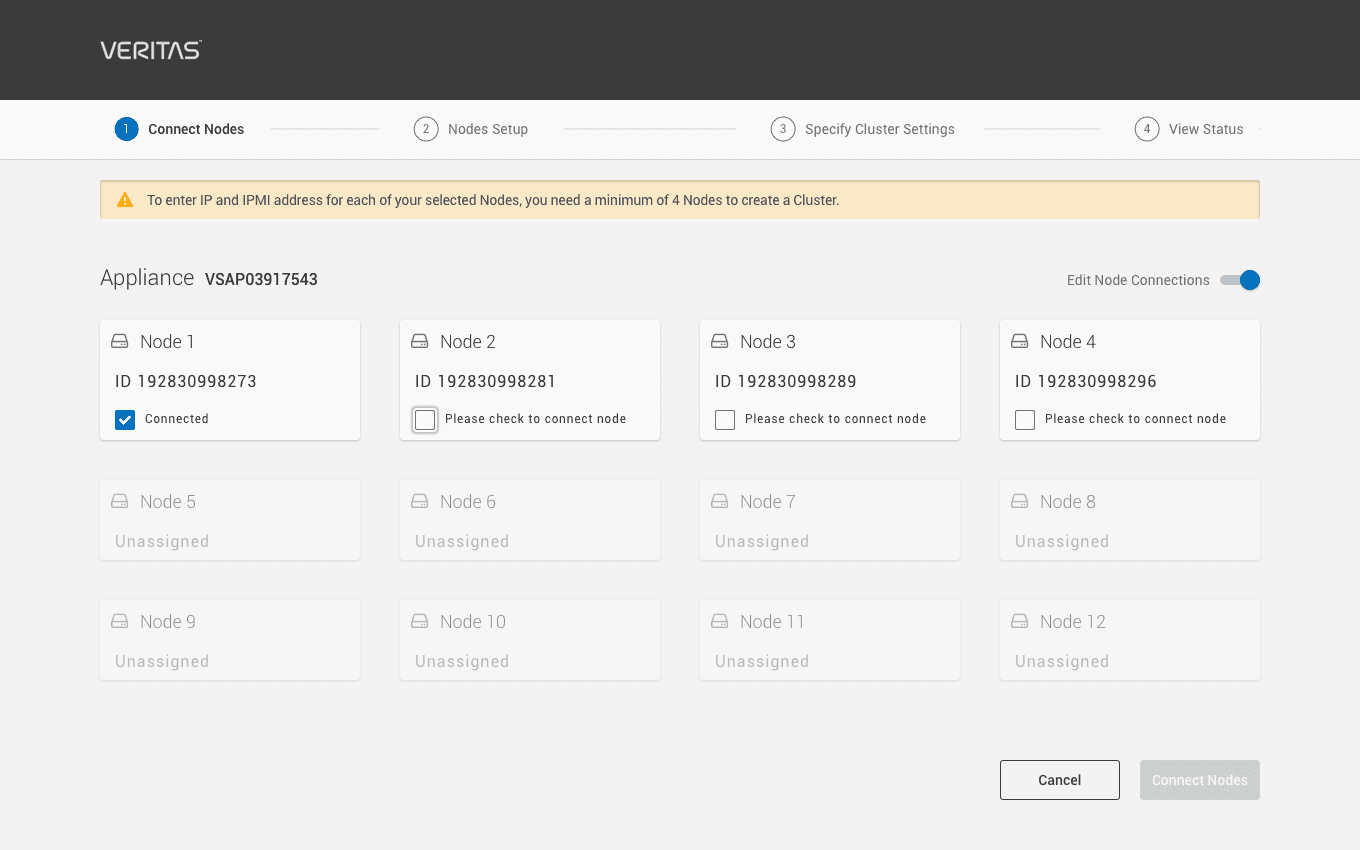
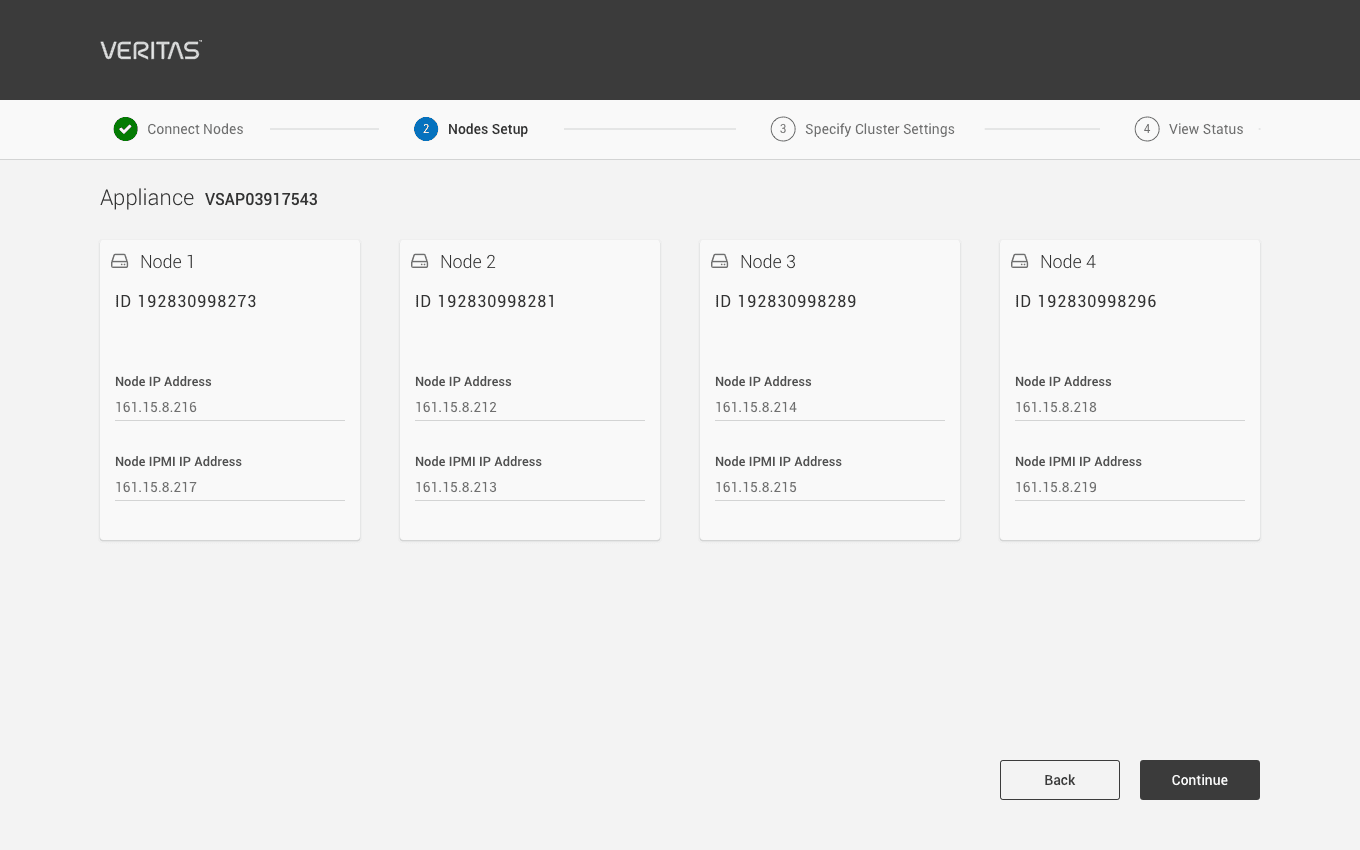
Building a cluster is four steps, shown at the top of every screen. Each node is a card. The administrator selects the nodes to connect, then enters two addresses for each. Unassigned nodes stay visible but out of the way.
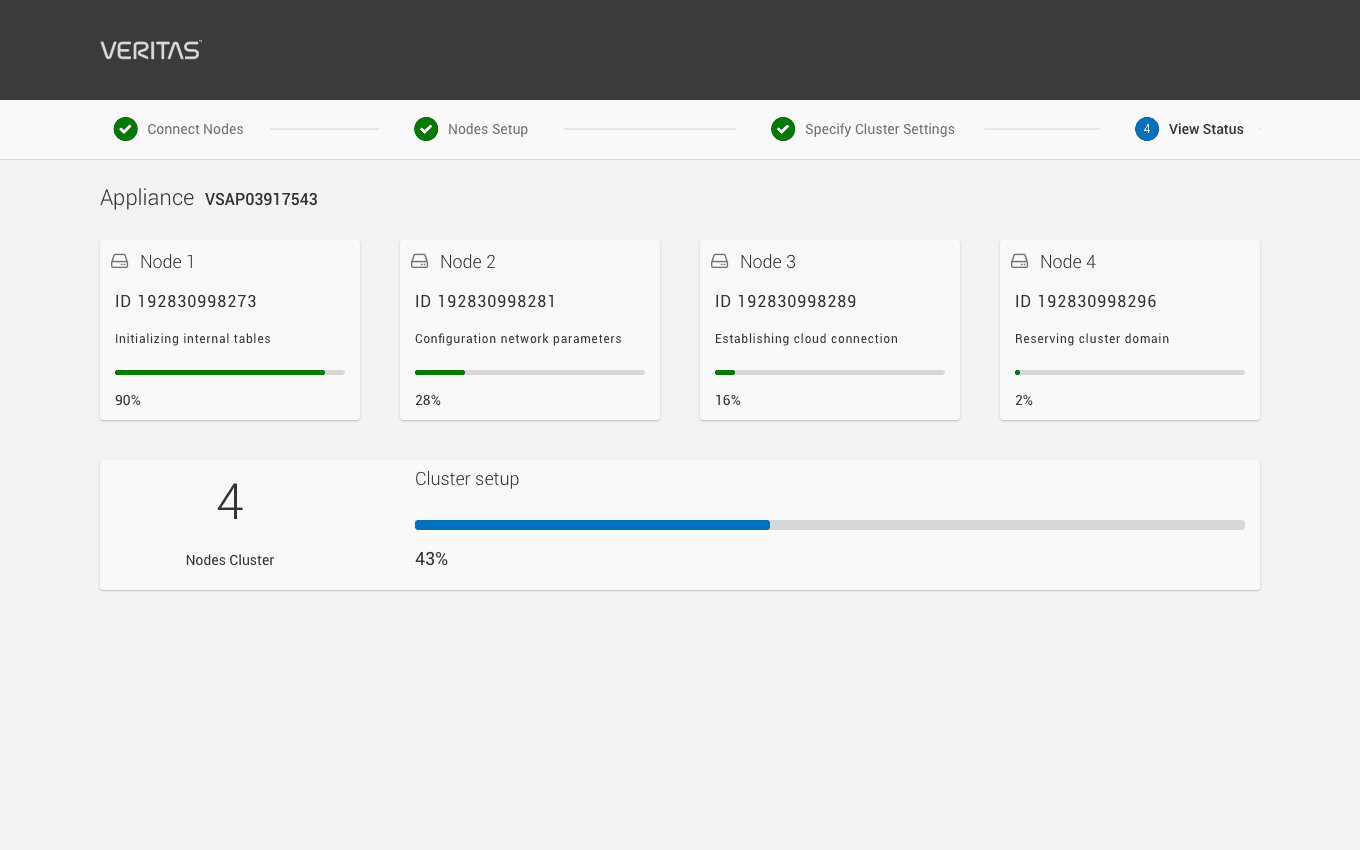
The last step reports progress for each node in plain language, and for the cluster as a whole.
The dashboard
The dashboard answers an administrator's first questions in the order they ask them. Did last night's backups run? Is anything unprotected? How much room is left, and how long will it last? Performance and usage follow below. Two actions stay in reach at the top: recover, and create a protection job.
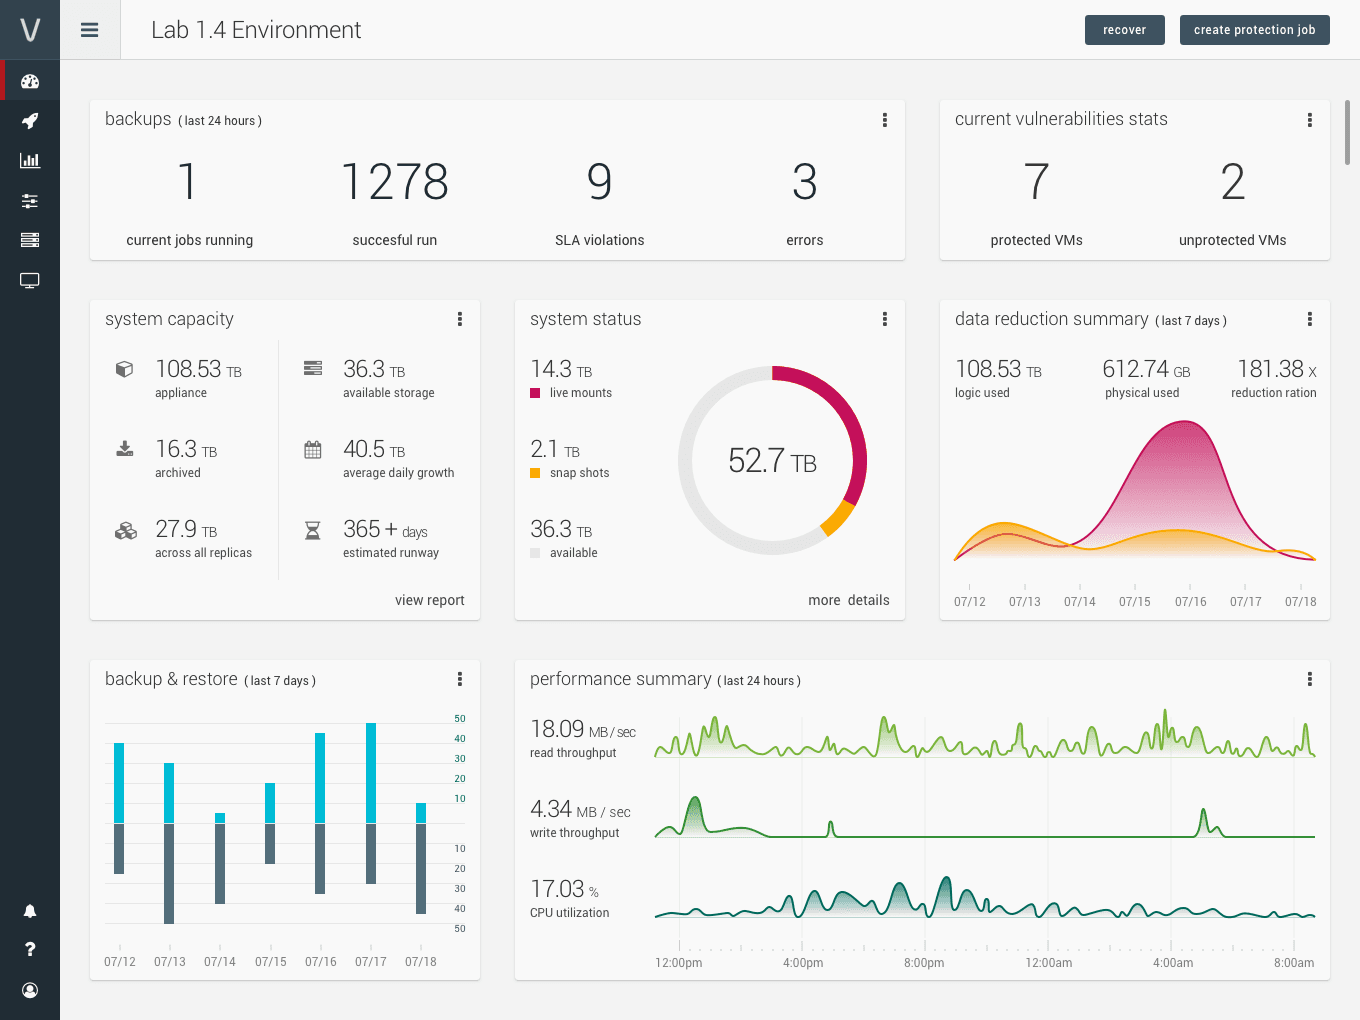
The dashboard is built from cards, so its contents can change with the environment. These variations test different cards and chart forms for cloud cache and for backup and restore activity.
The work connects three audiences who rarely see the same material: the teams building the APIs, the administrator installing the product, and the administrator running it a year later.
Have a project in mind?
We take on a limited number of projects each quarter. Tell us what you're building.
Get in touch →