Enertiv
A building operations platform for commercial real estate, from a portfolio-wide score down to a single piece of equipment.
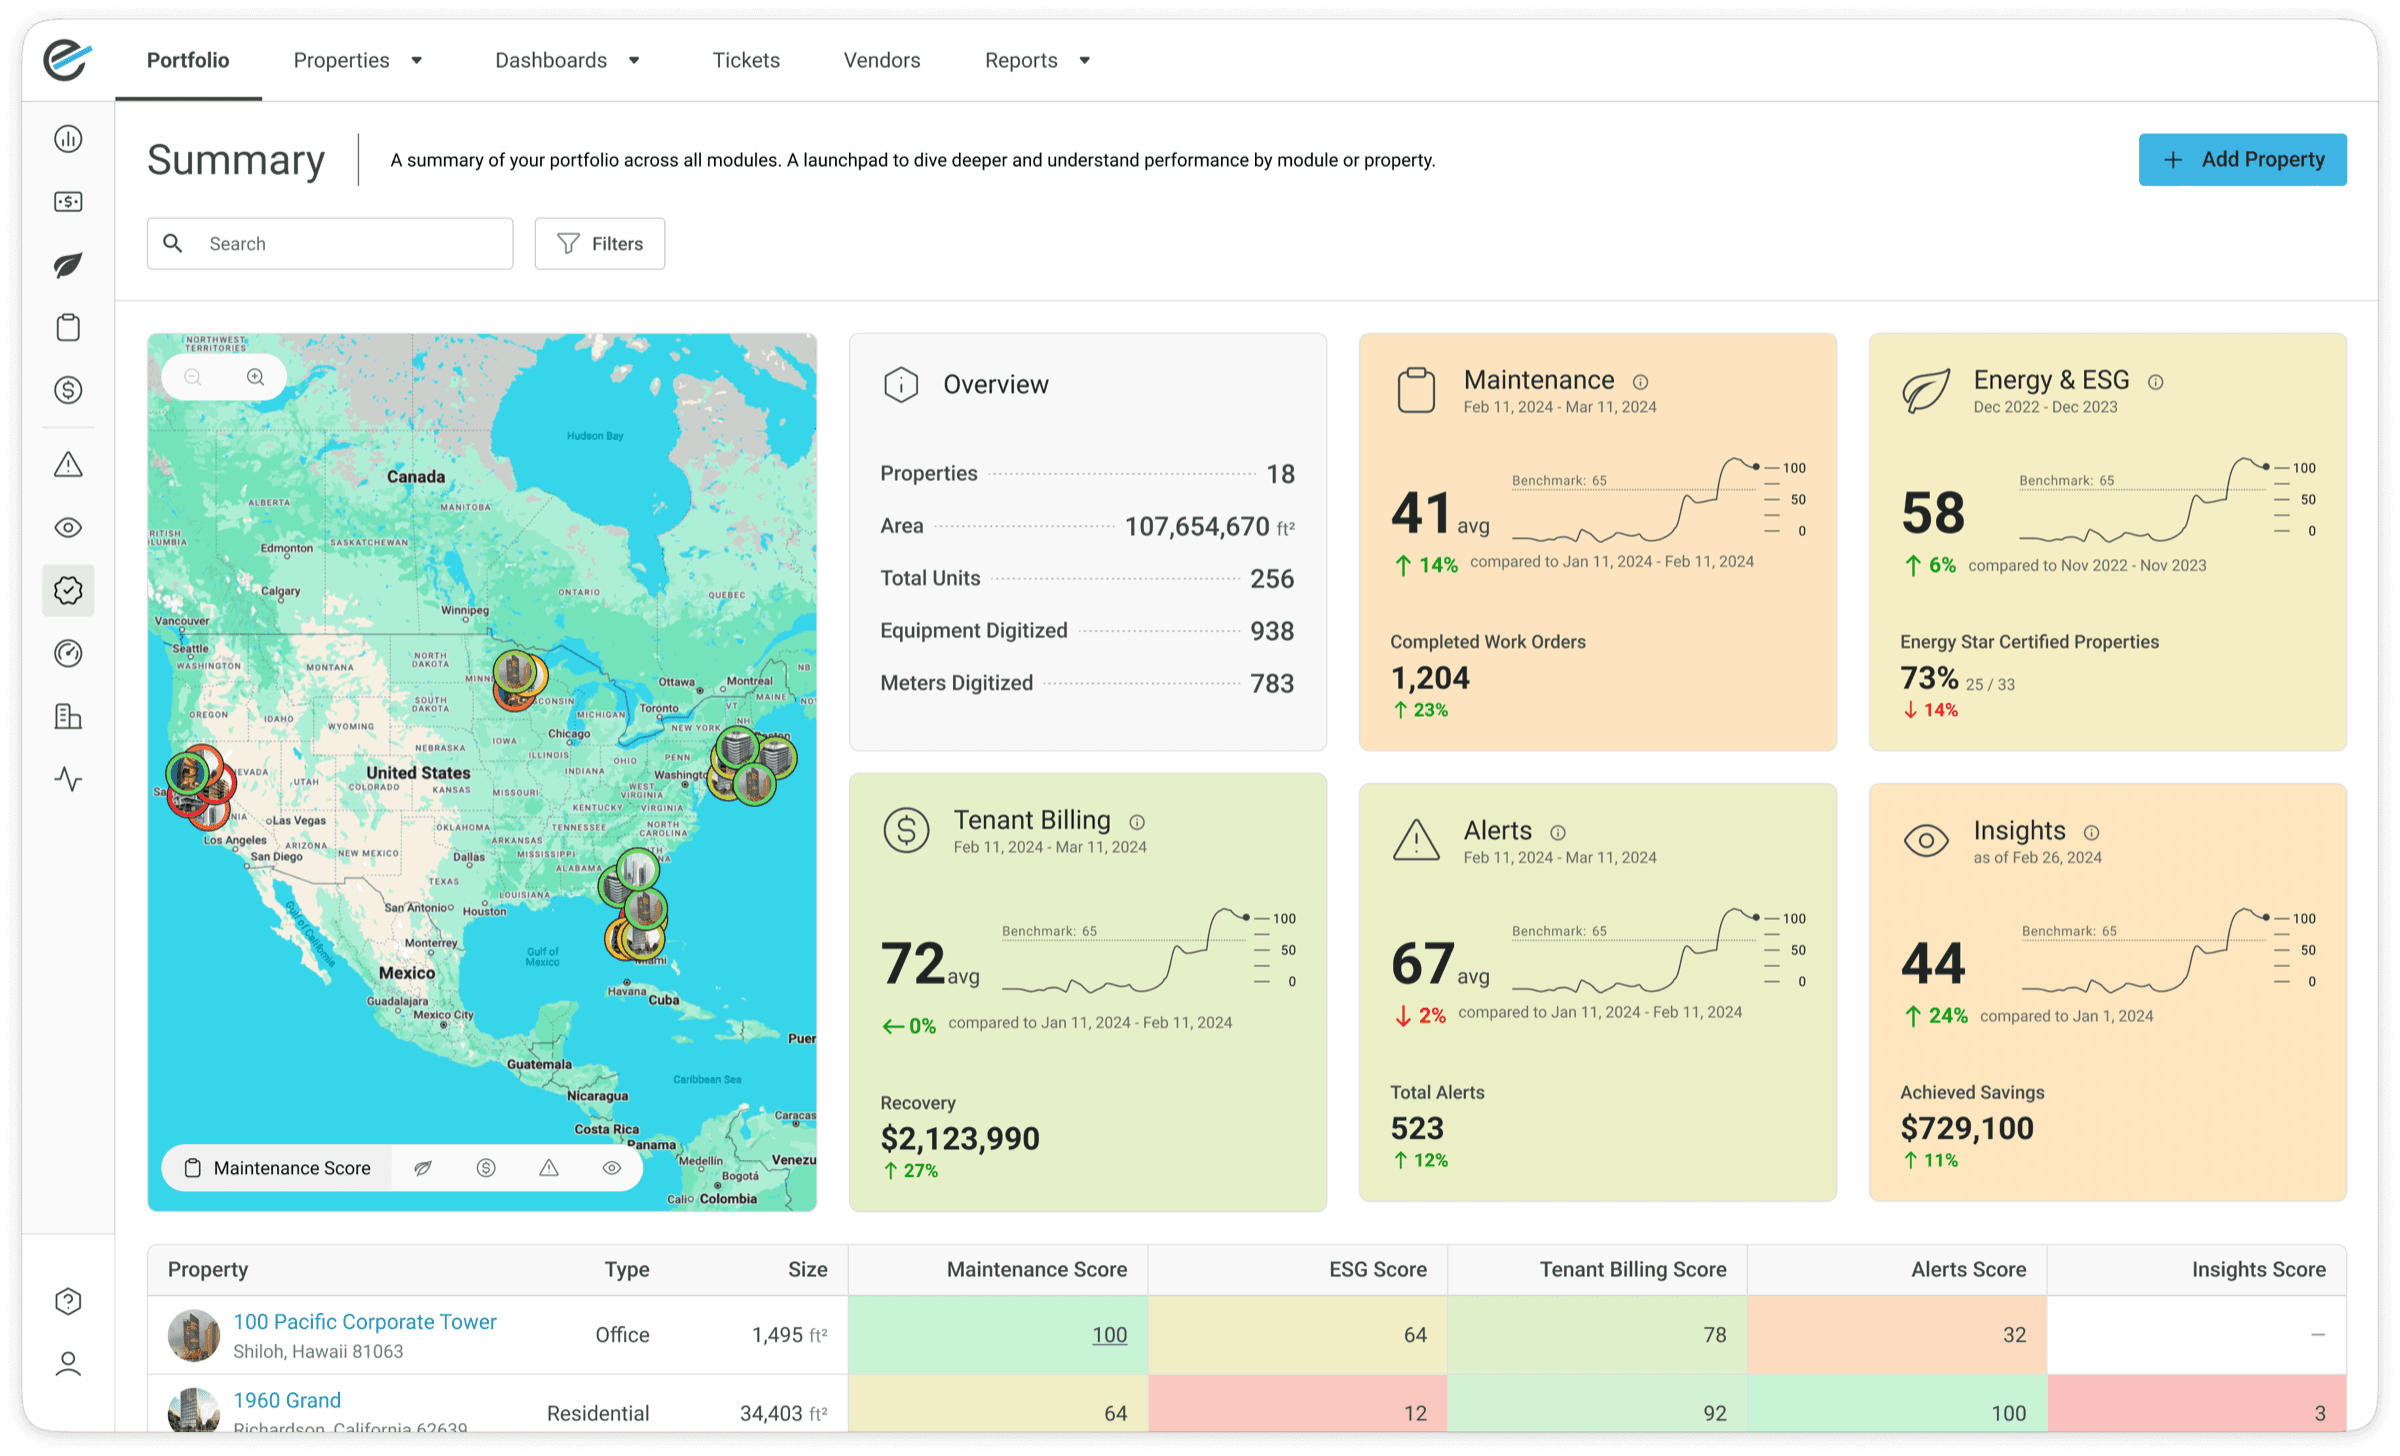
The portfolio summary places every property on a map beside five module scores: maintenance, energy and ESG, tenant billing, alerts, and insights. The table below scores each building on the same scale, so the weakest result is visible without reading a single number.
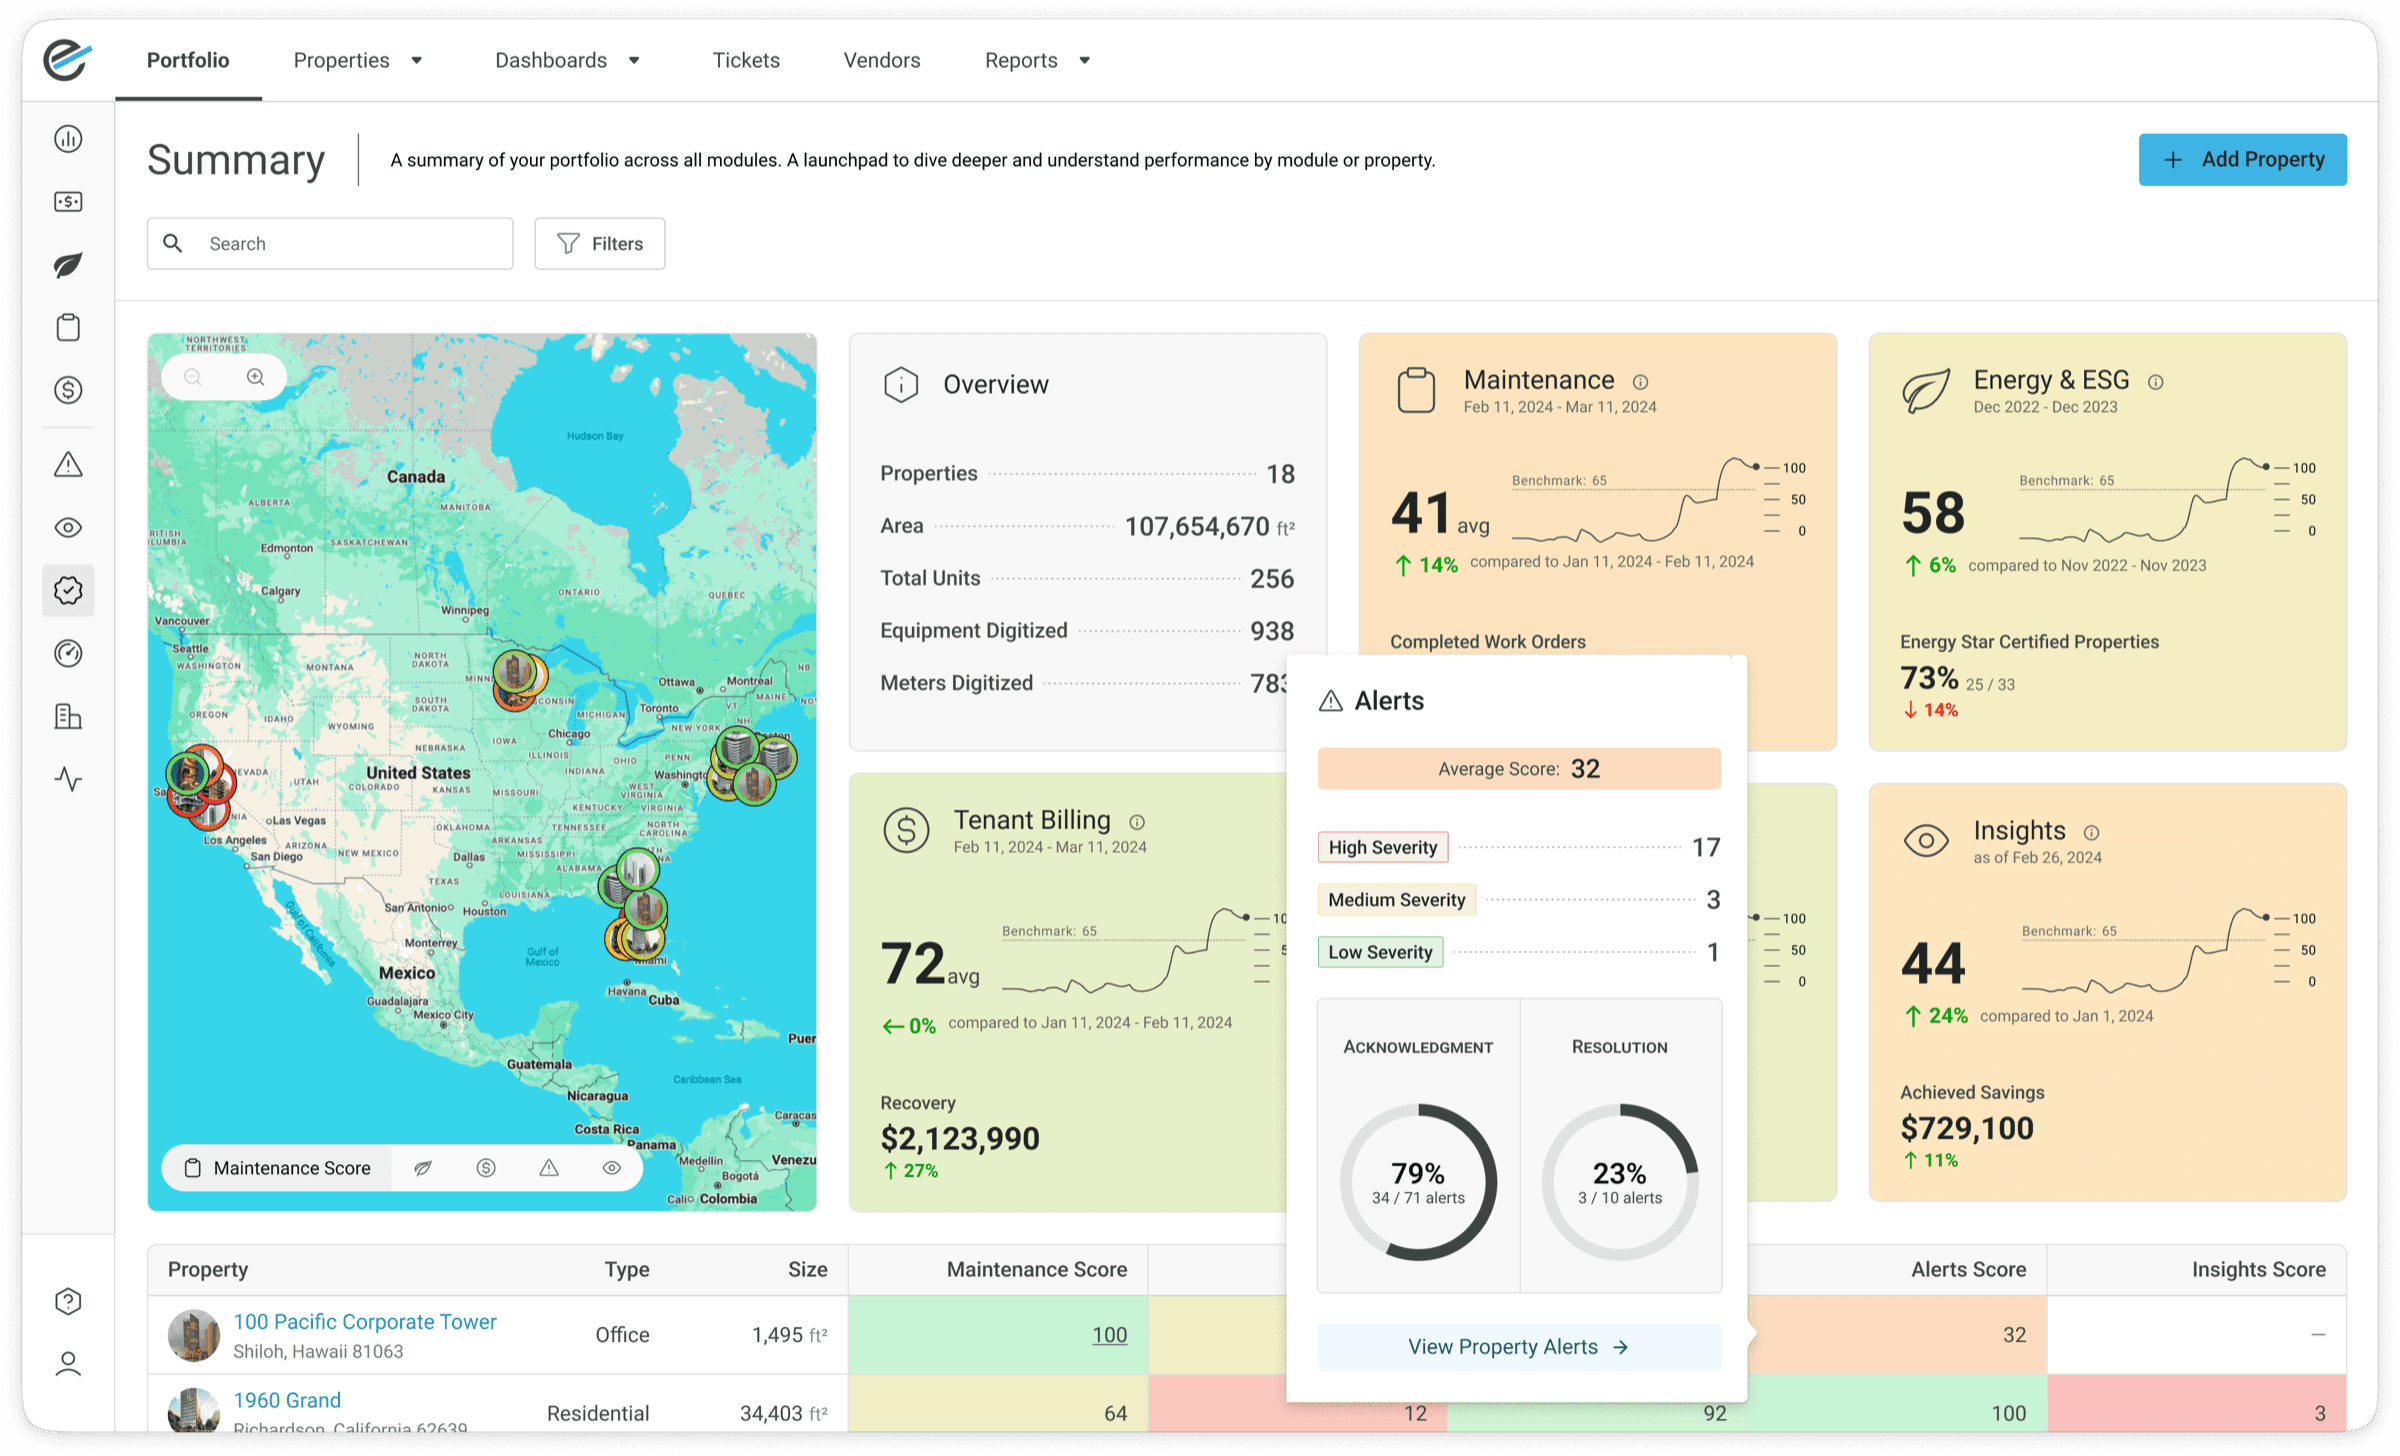
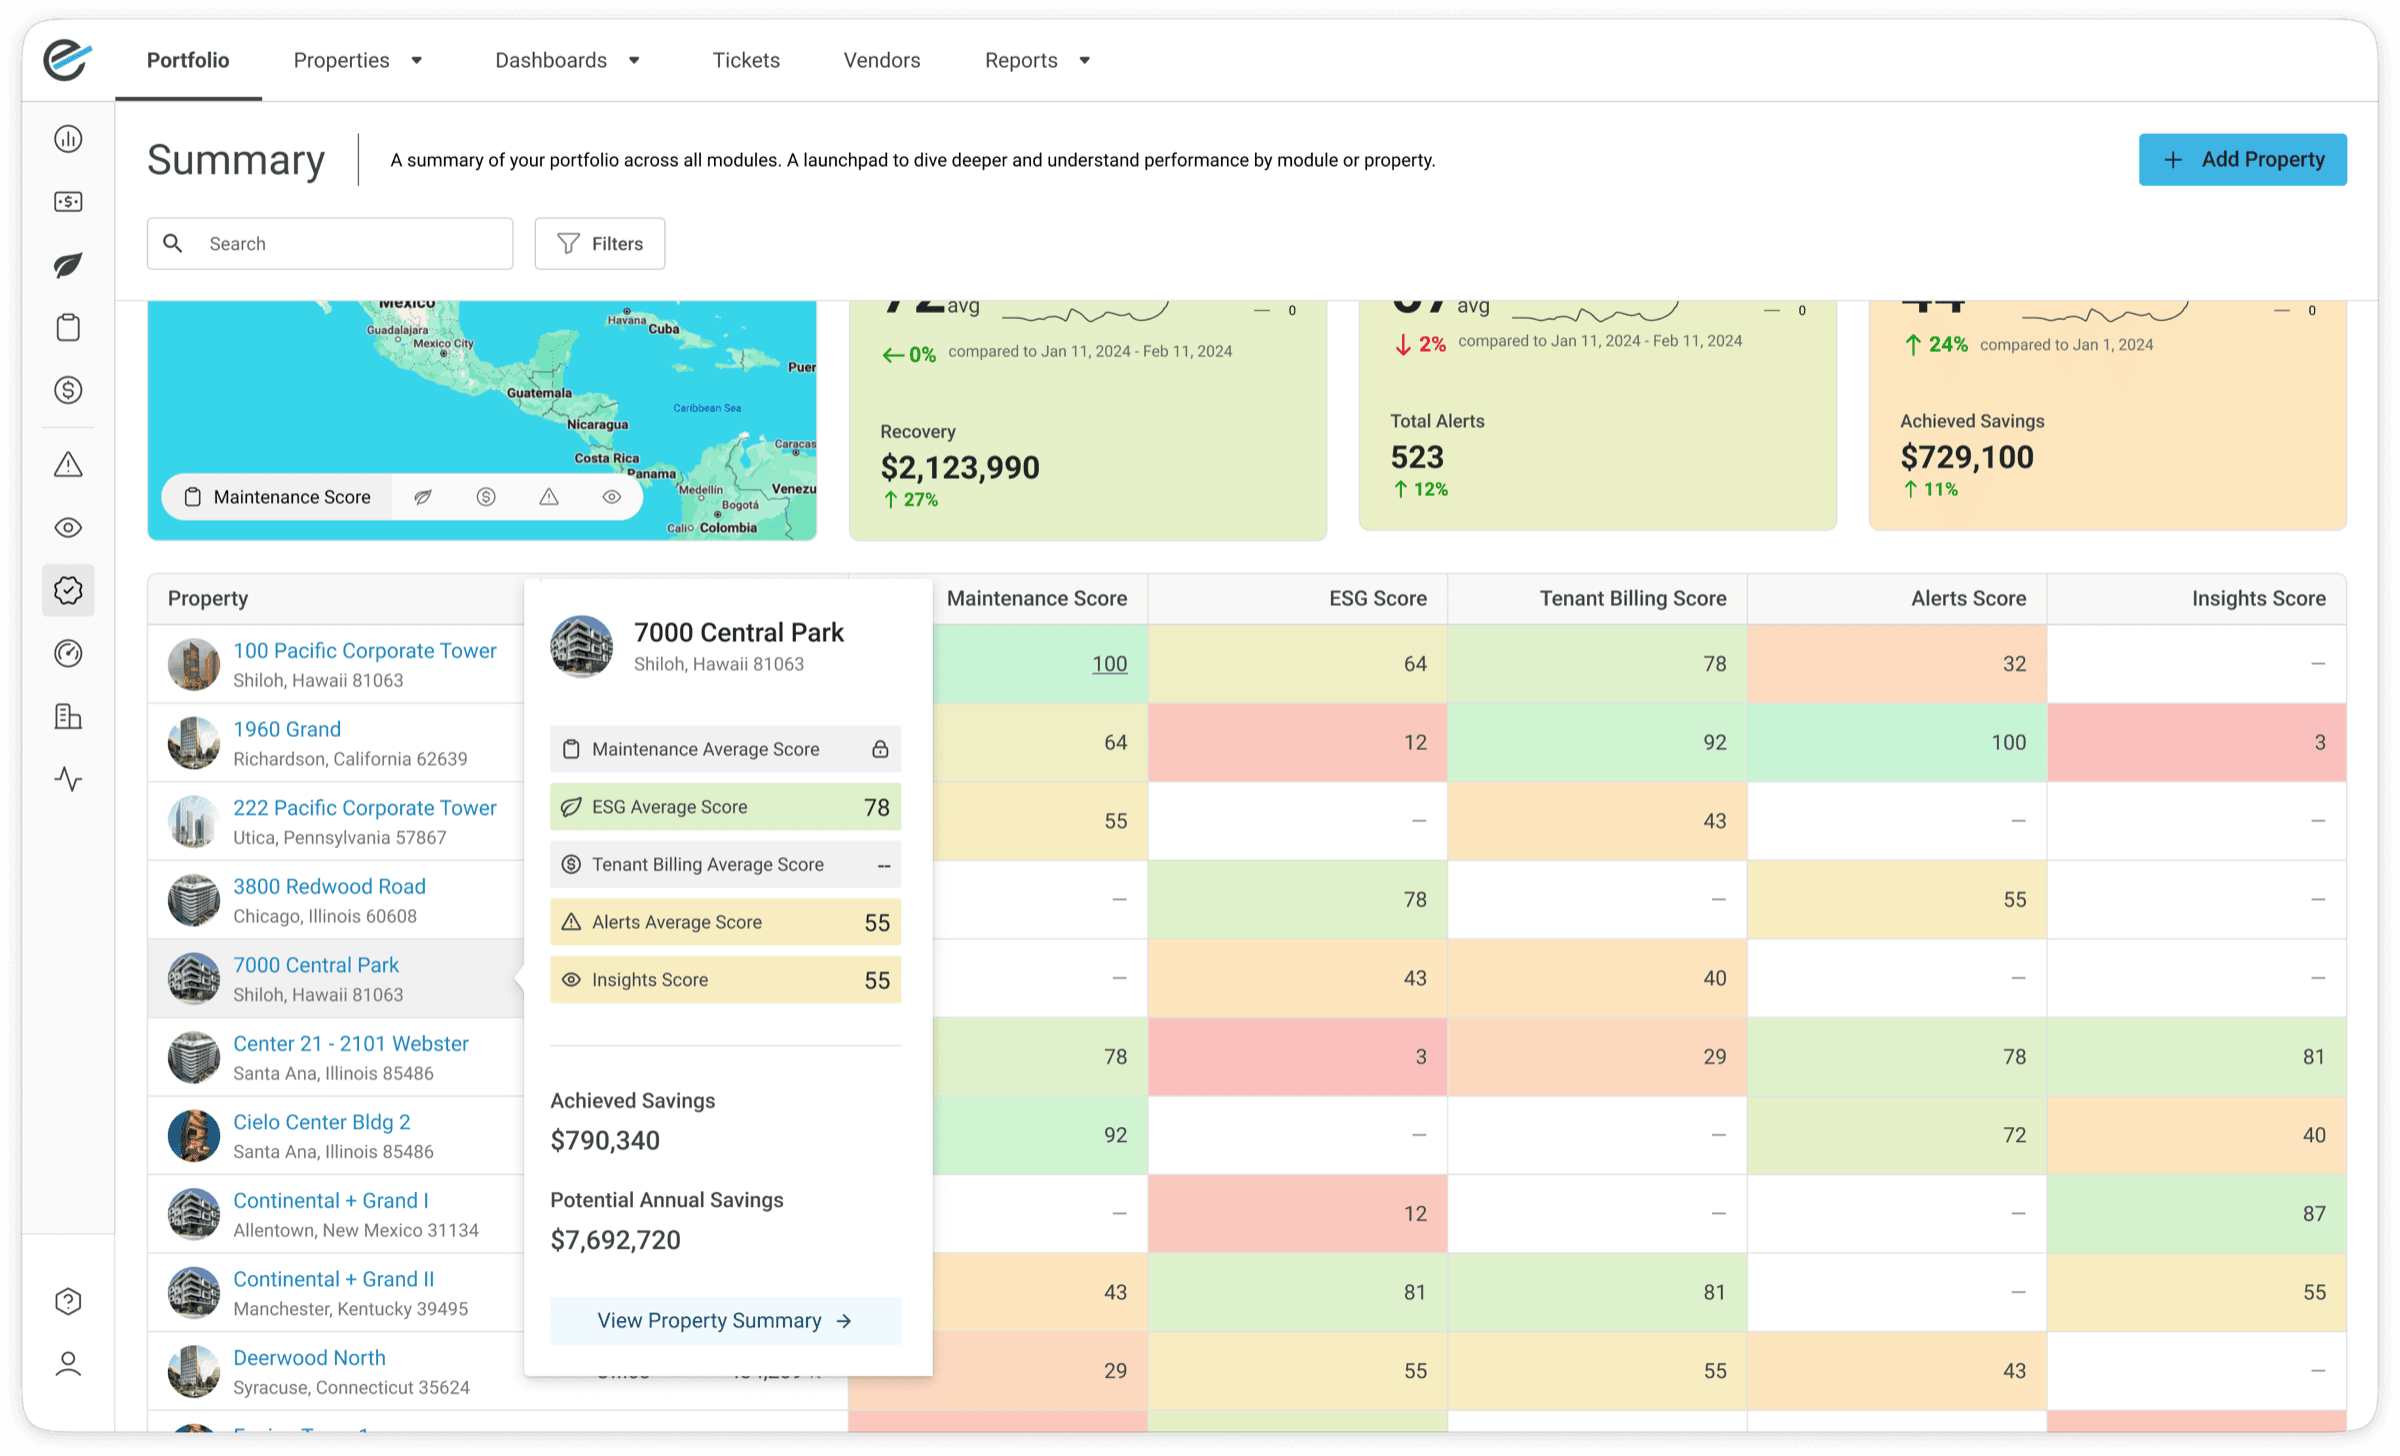
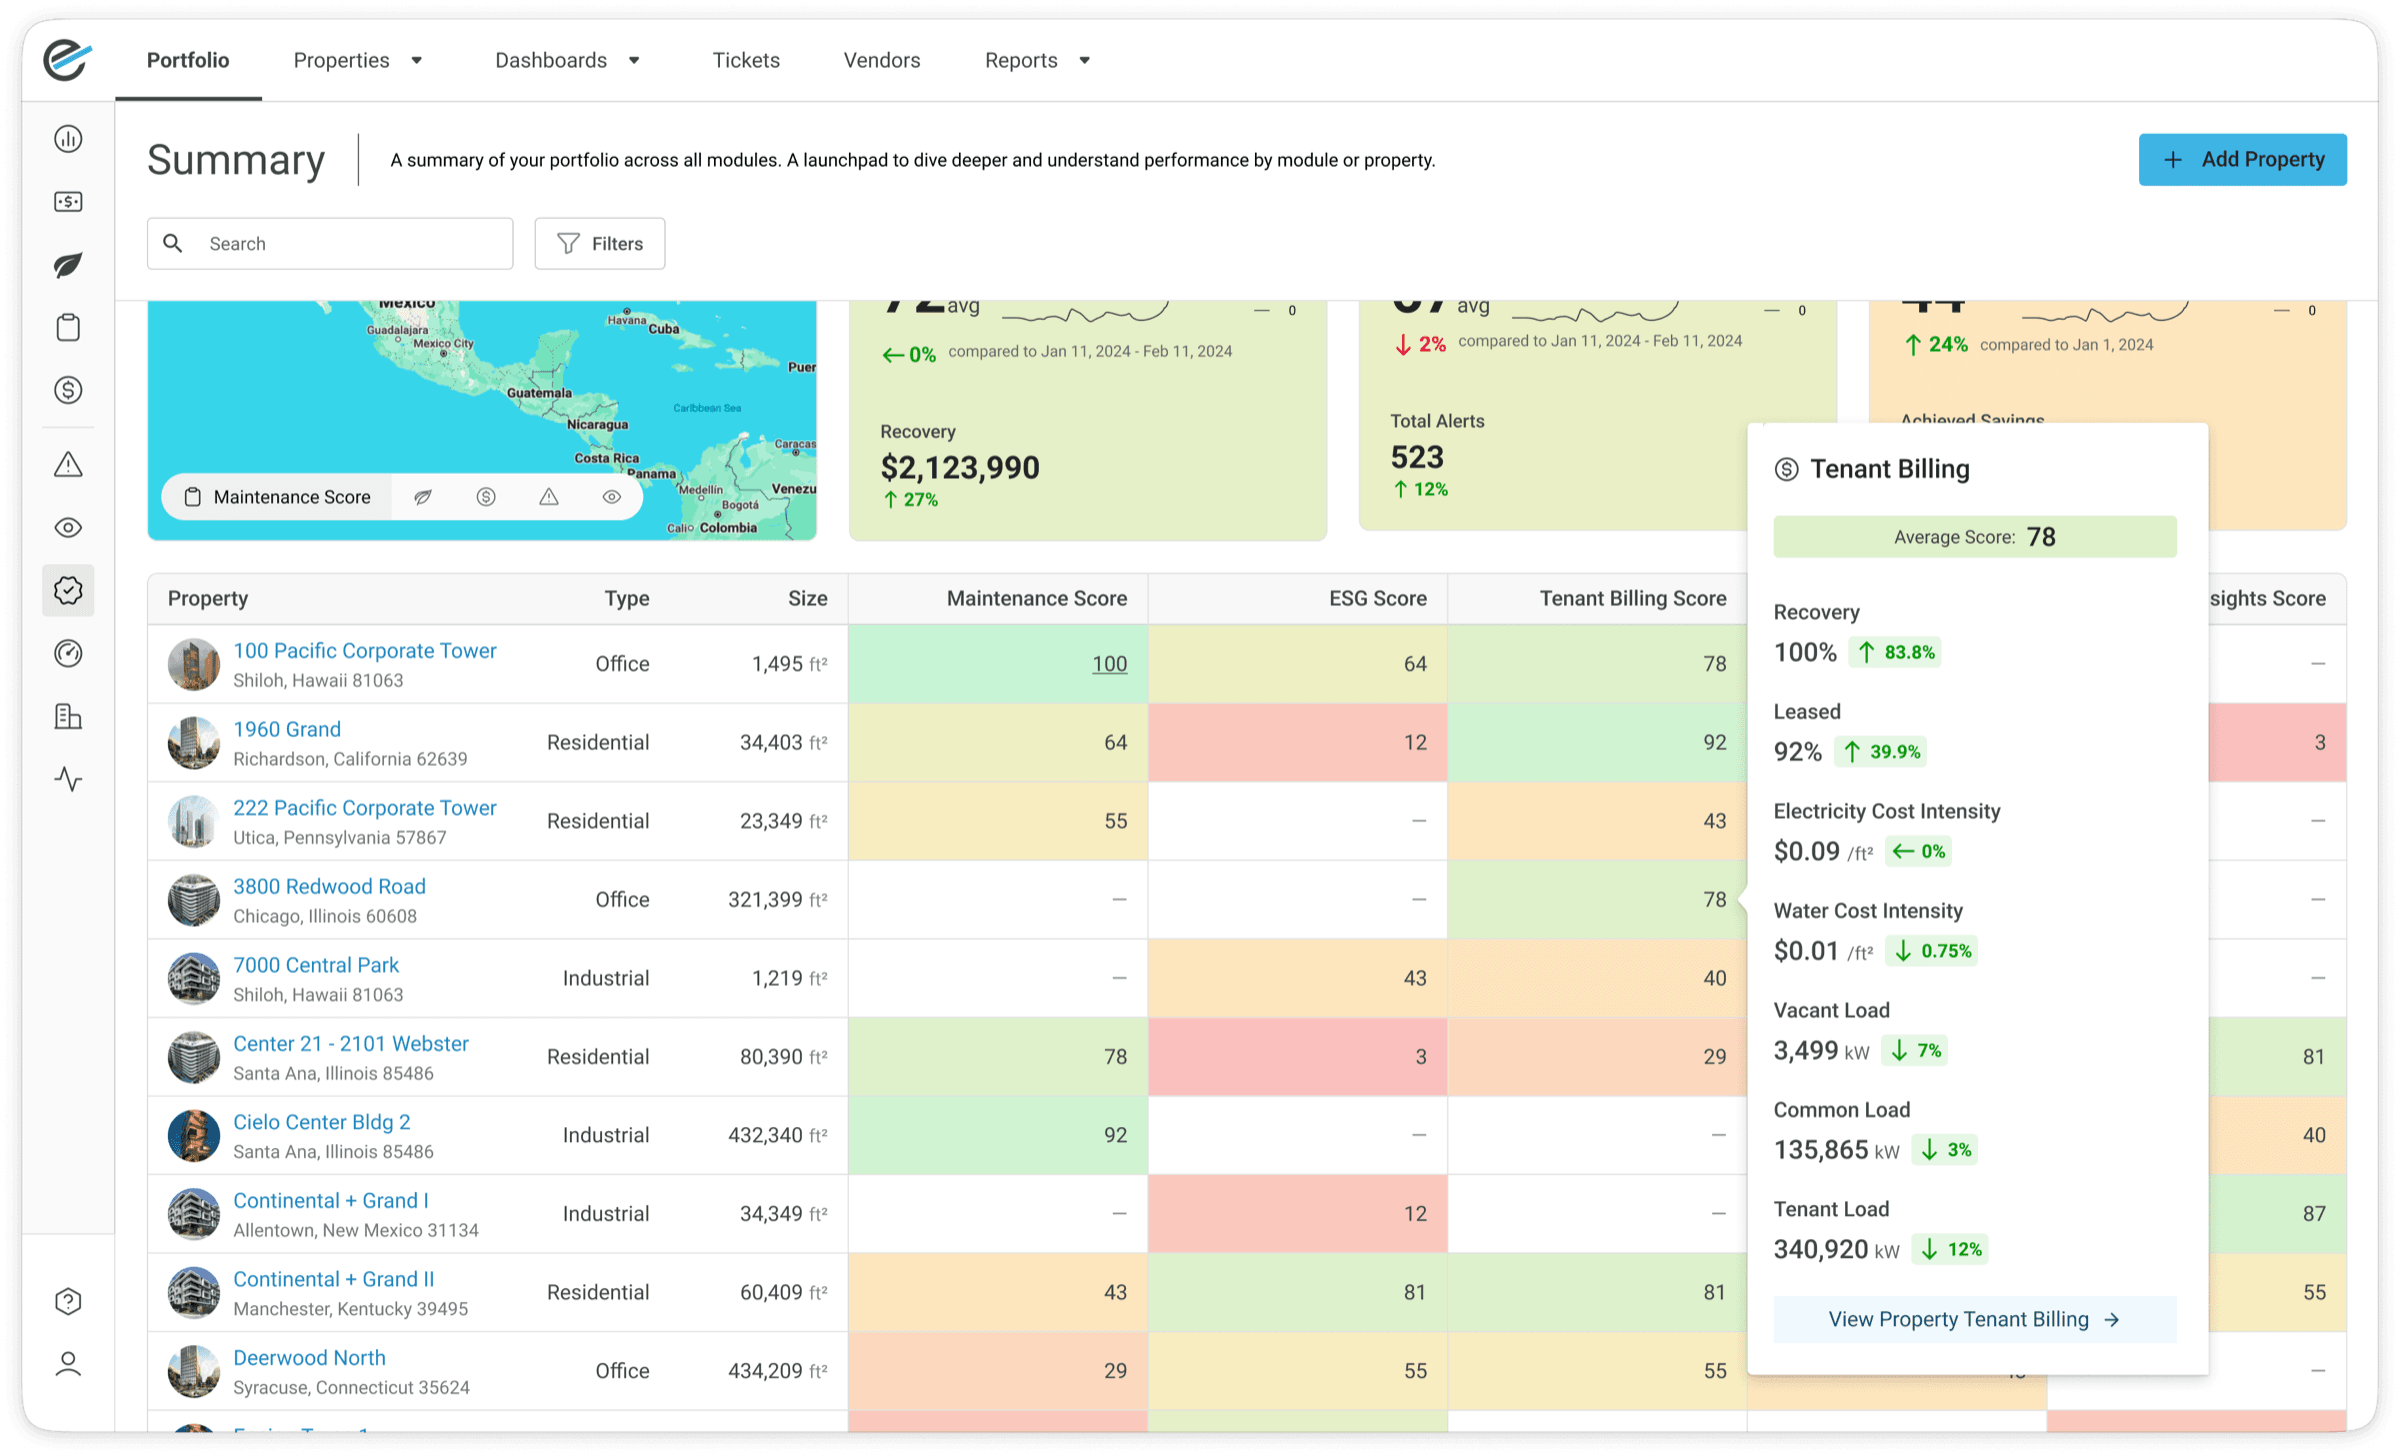
Selecting a score opens its breakdown in place. Alert severity, acknowledgment, and resolution rates appear beside the row they describe, with a direct route to the property.
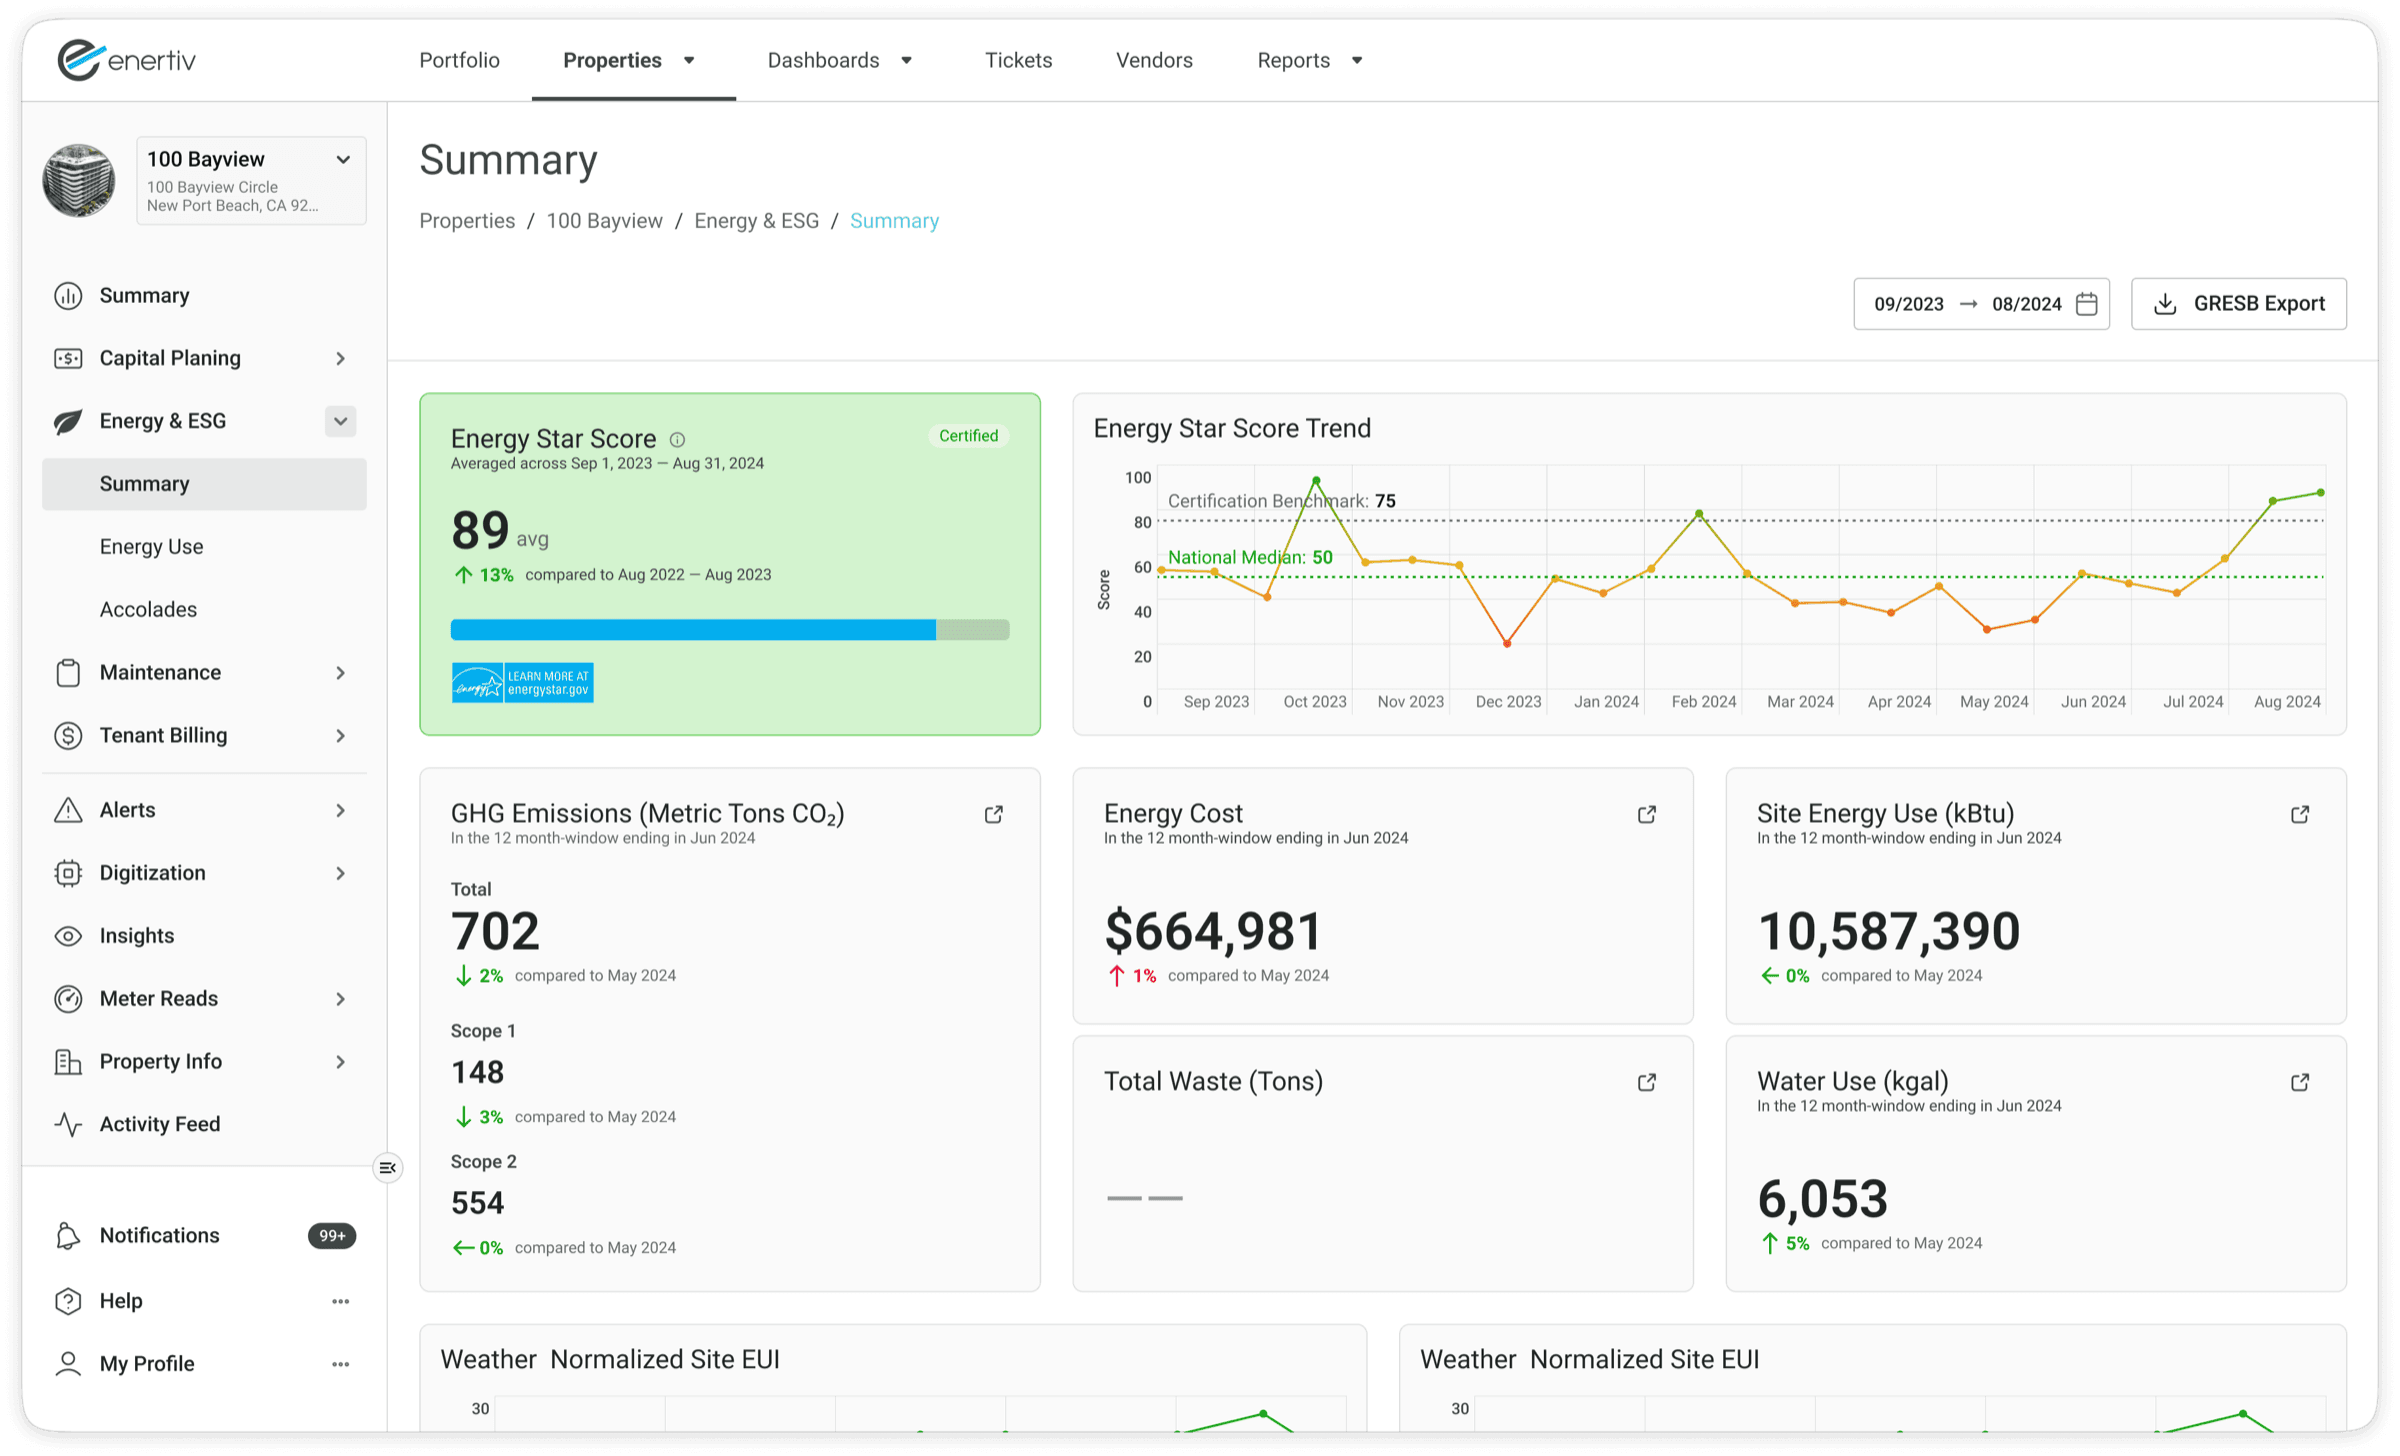
Each property has an Energy and ESG summary: Energy Star score against the certification benchmark and national median, emissions by scope, and energy, water, and waste totals. The reporting period and export sit at the top of the page.
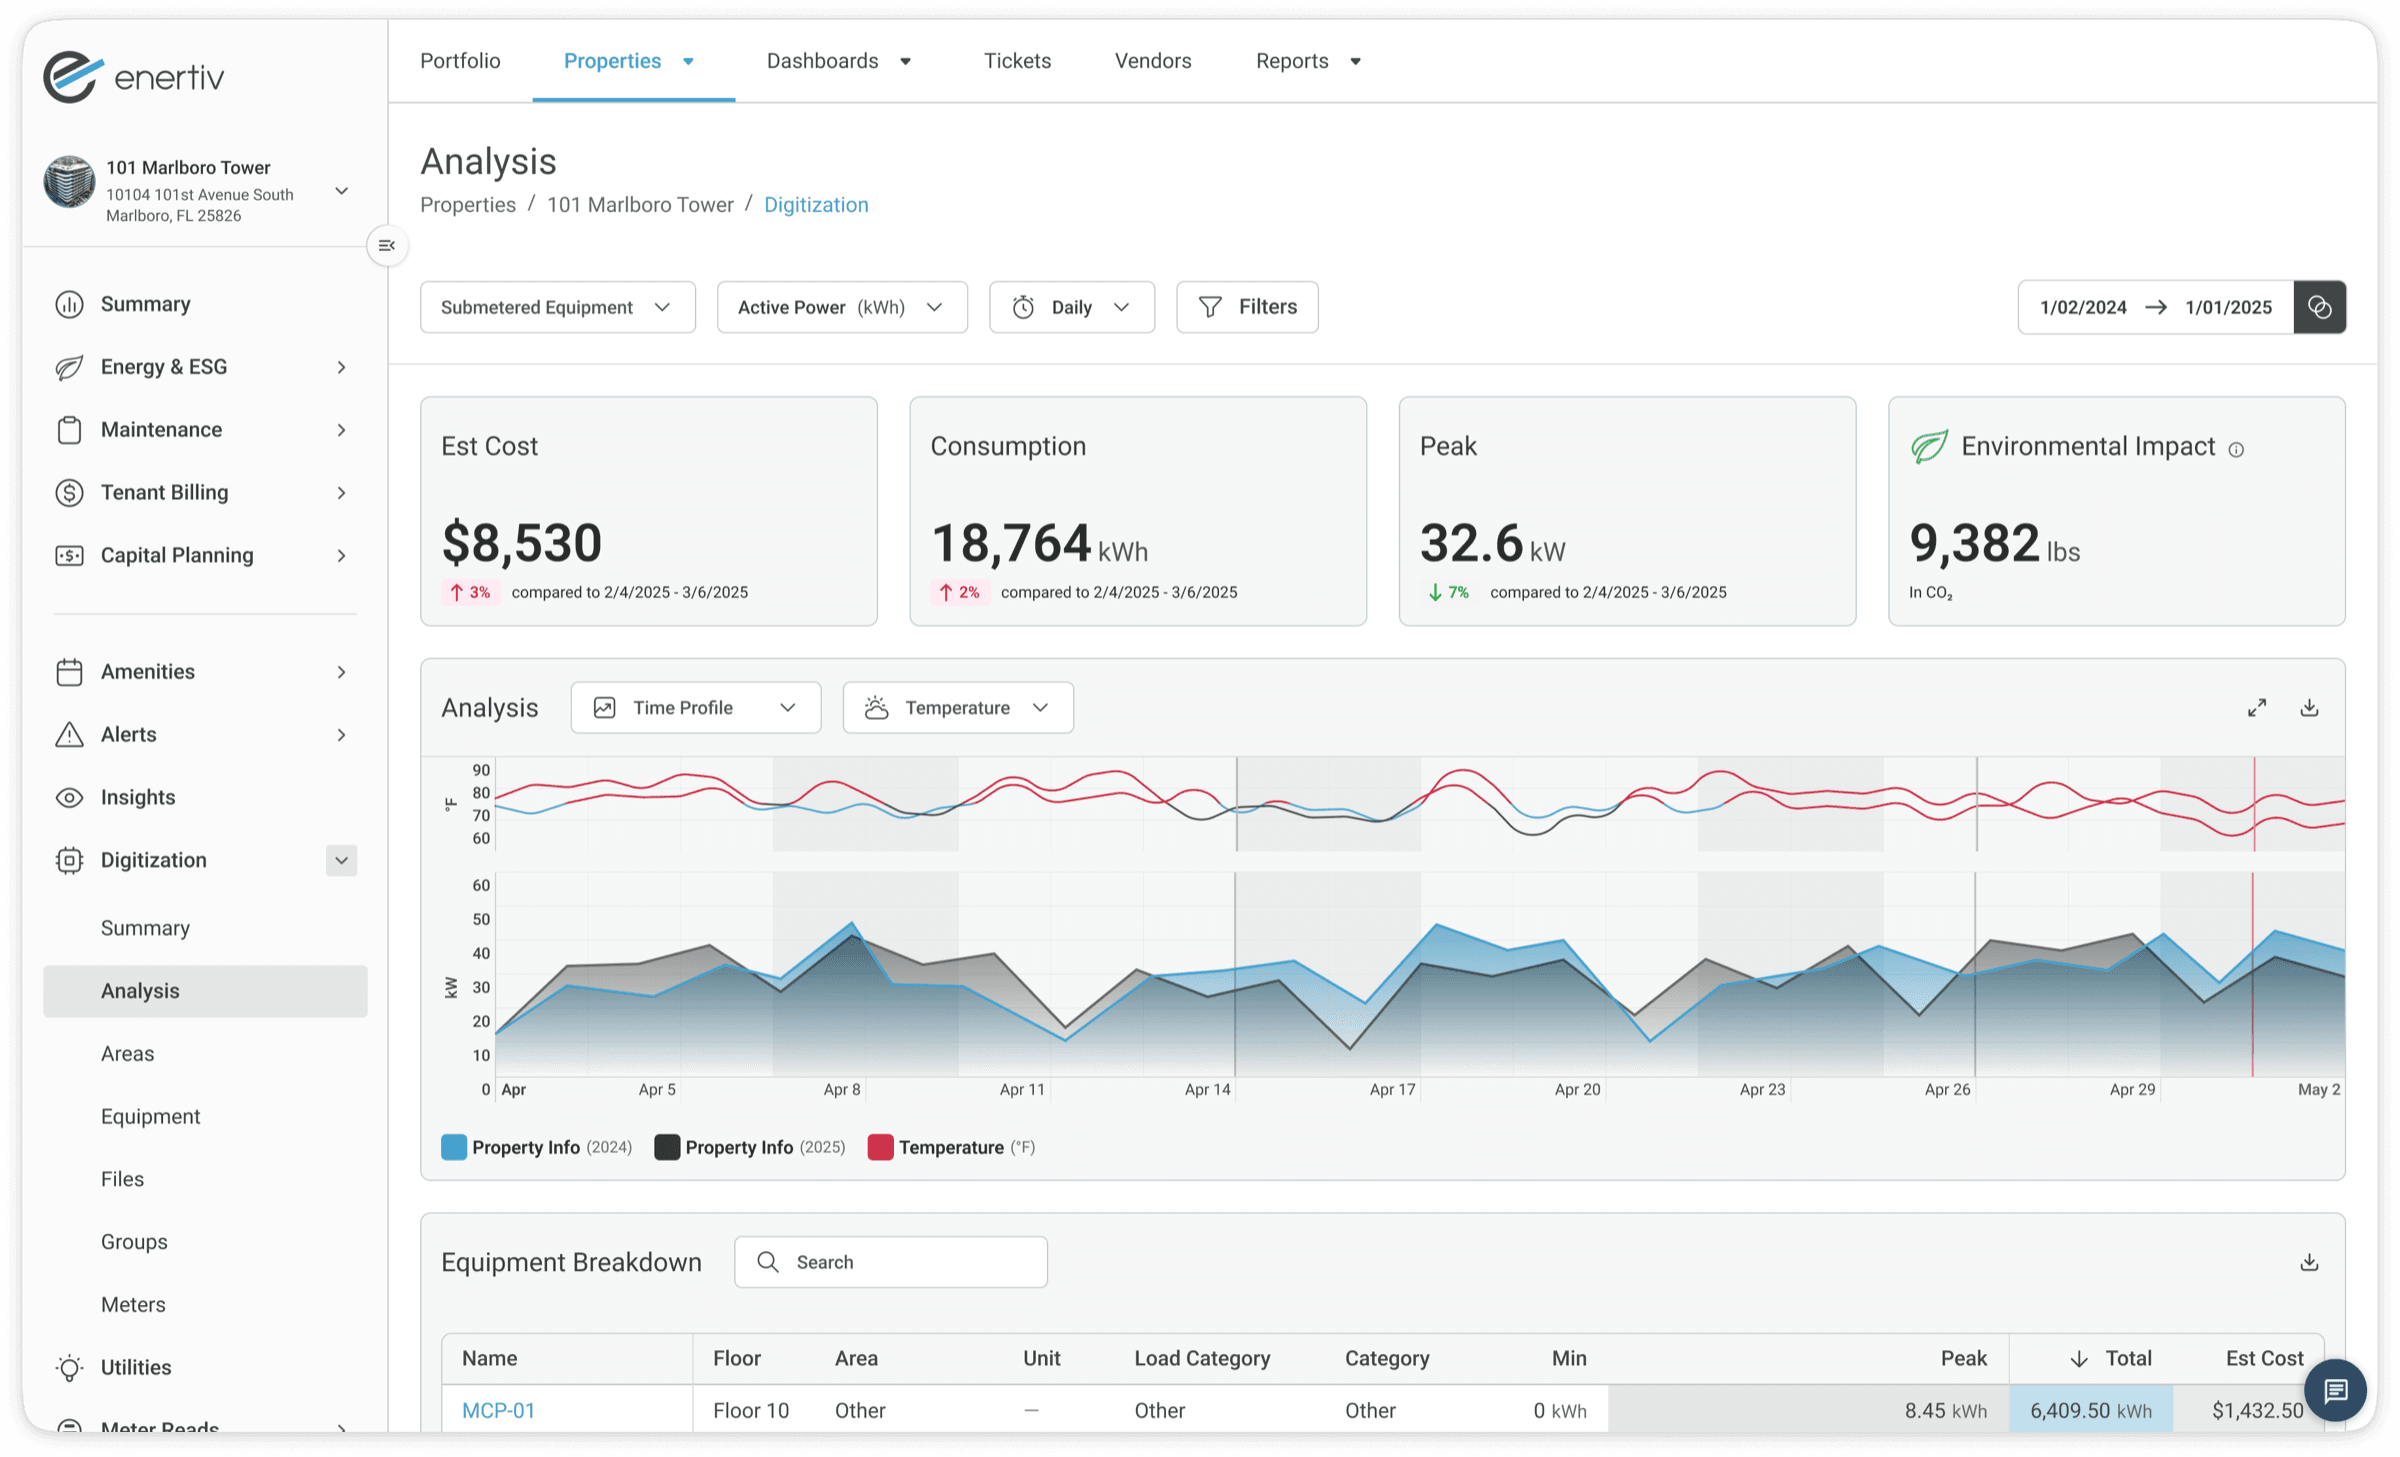
The analysis view sets submetered power against outdoor temperature on a shared timeline, comparing one year with the next, with cost, consumption, peak, and environmental impact above and an equipment breakdown below.
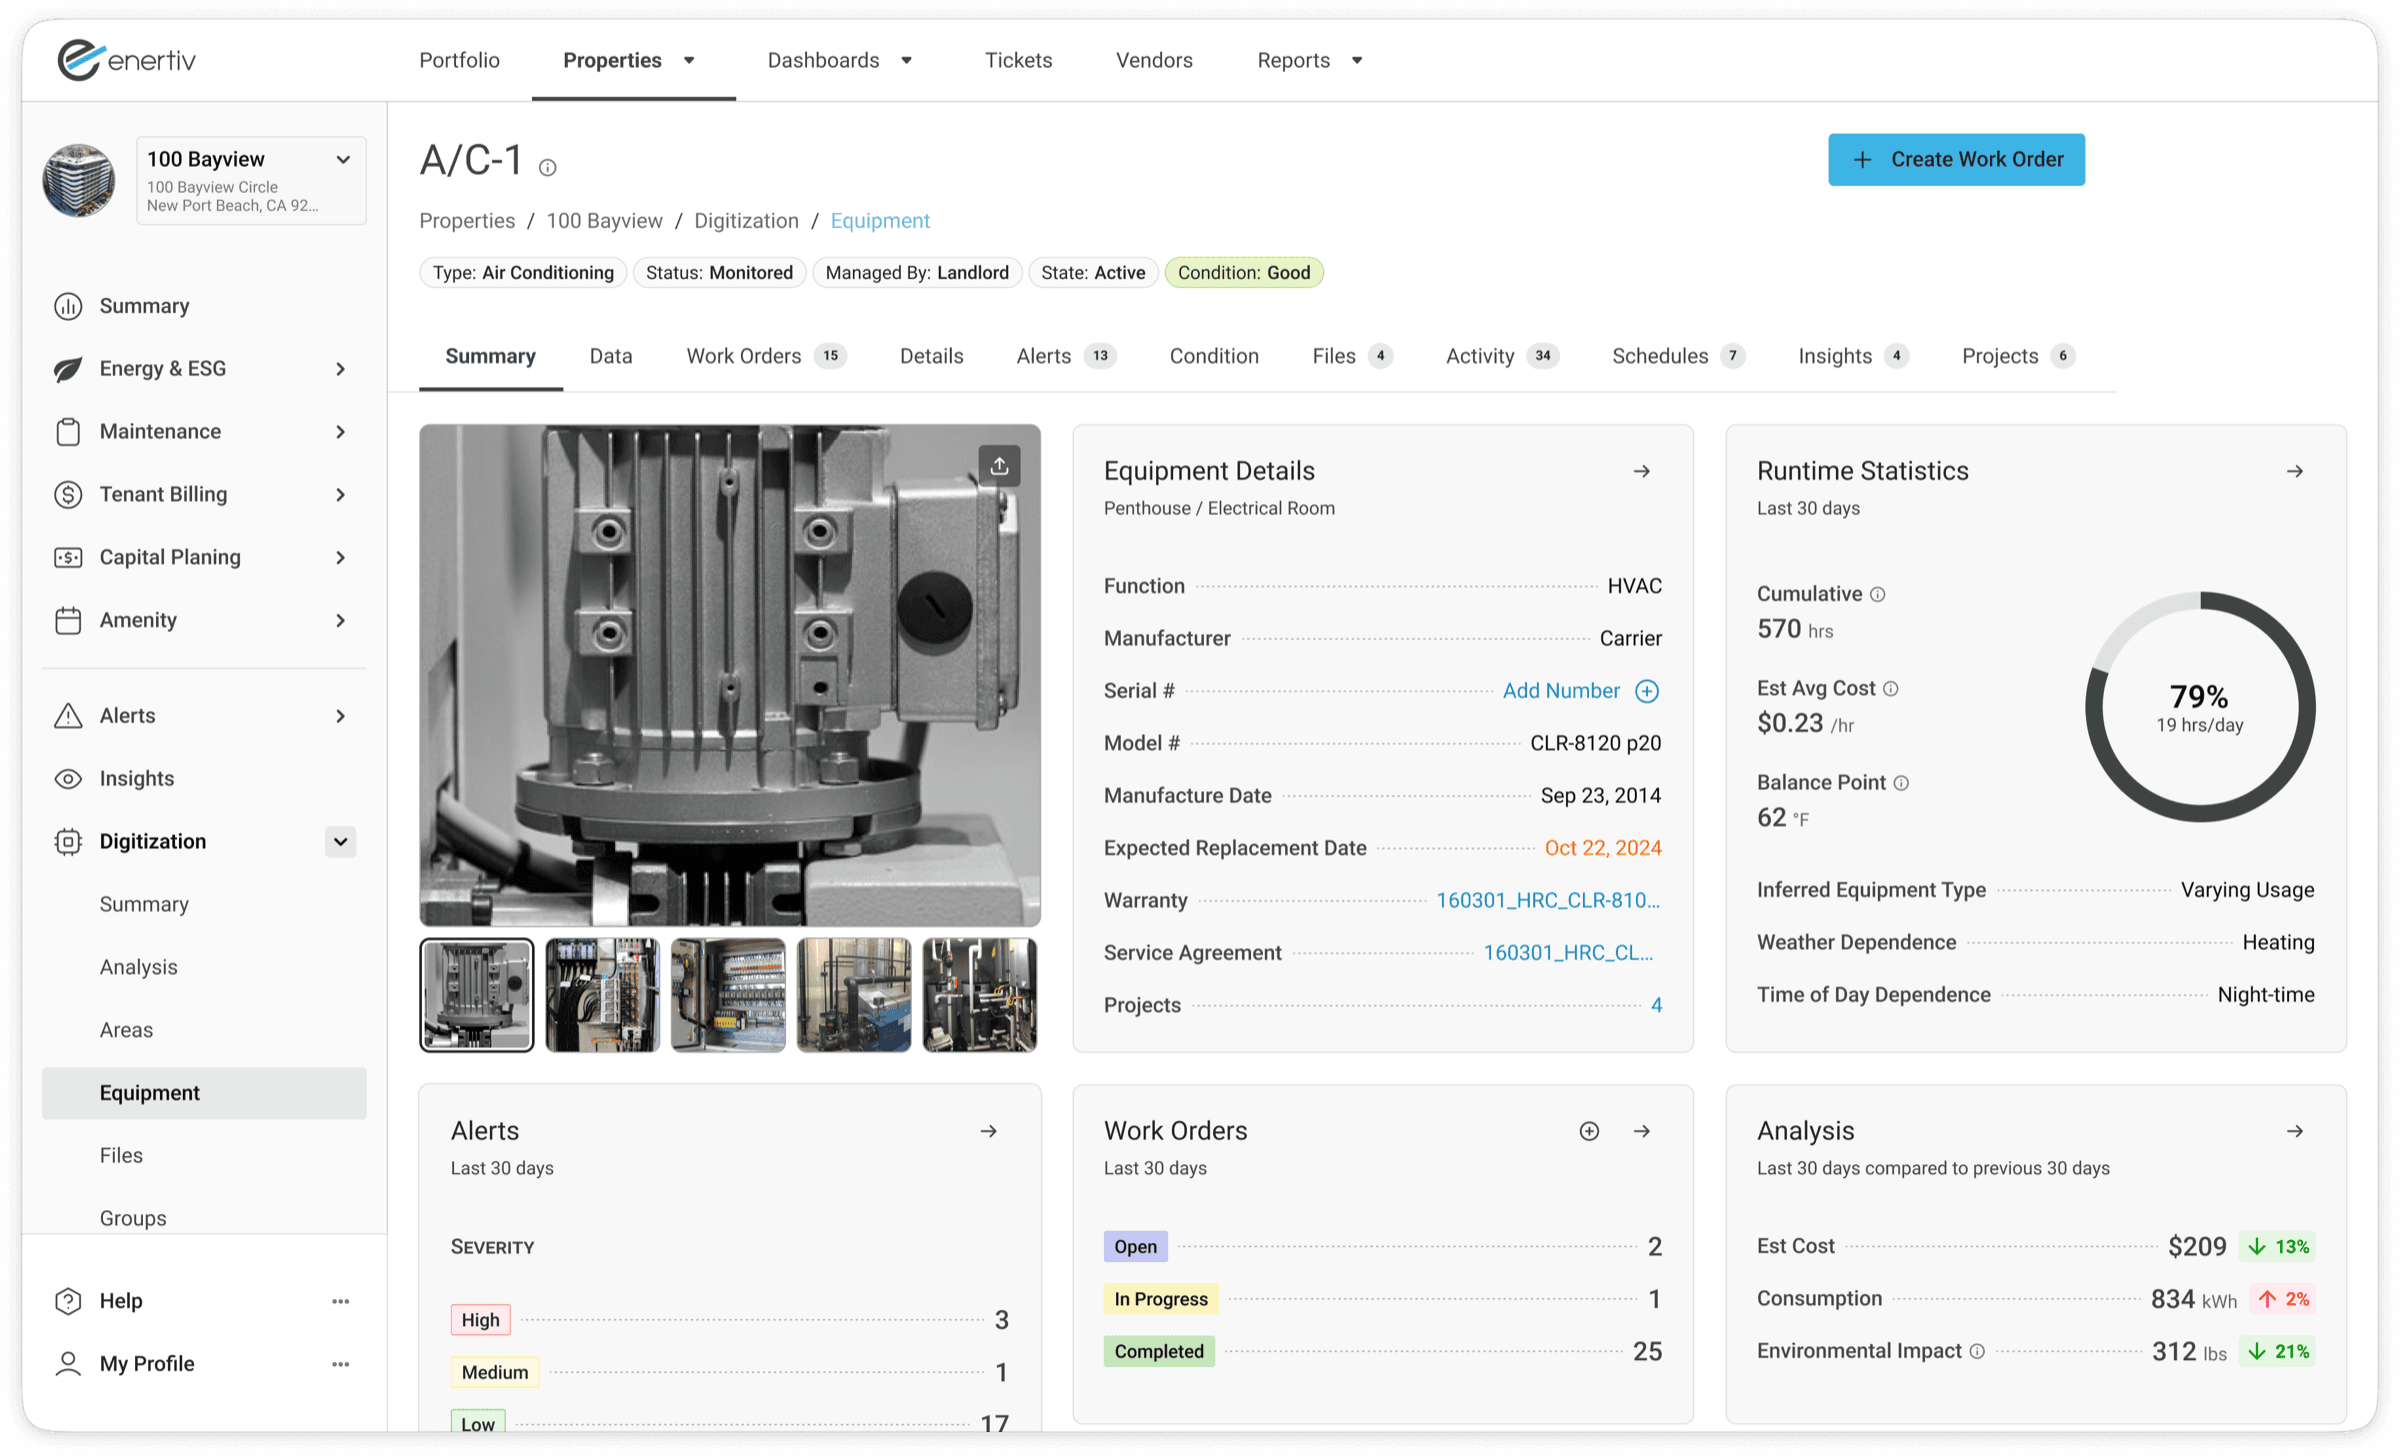
Every asset has one page. Specifications, runtime statistics, alerts, and work orders sit together, so an engineer can judge a unit's condition and act on it without changing context.
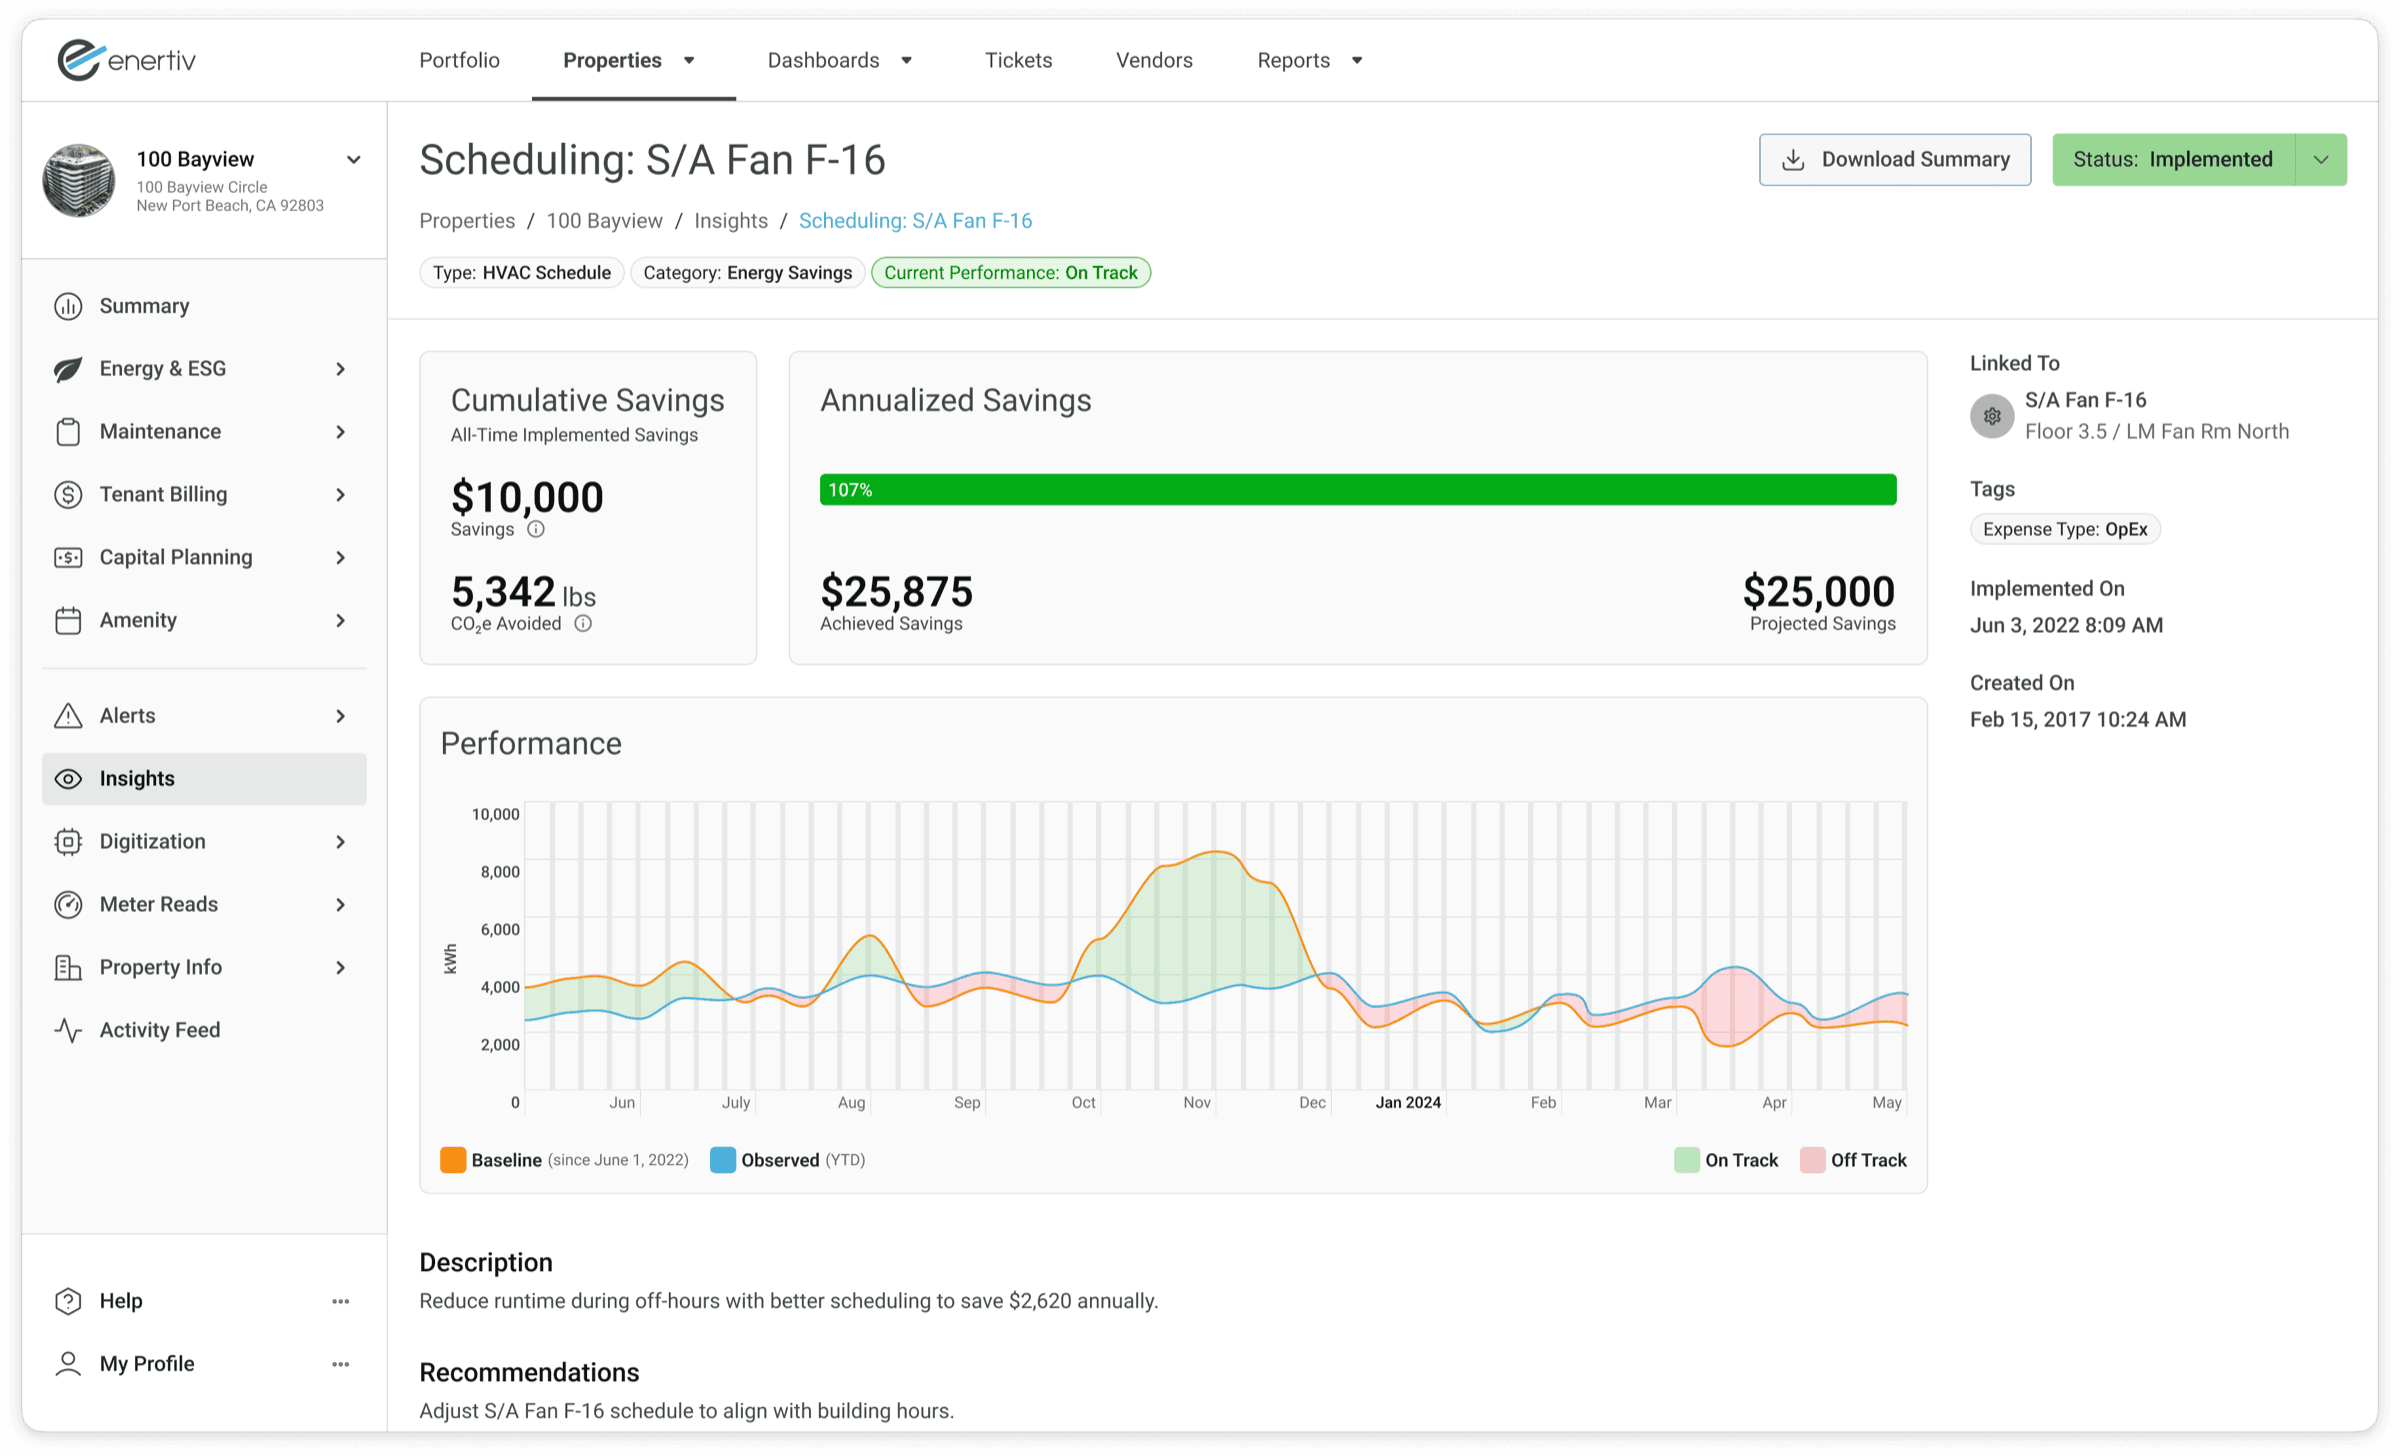
Insights close the loop. Once a recommendation is implemented, the page tracks achieved savings against the projection and shows where observed use ran above or below the baseline.
Have a project in mind?
We take on a limited number of projects each quarter. Tell us what you're building.
Get in touch →